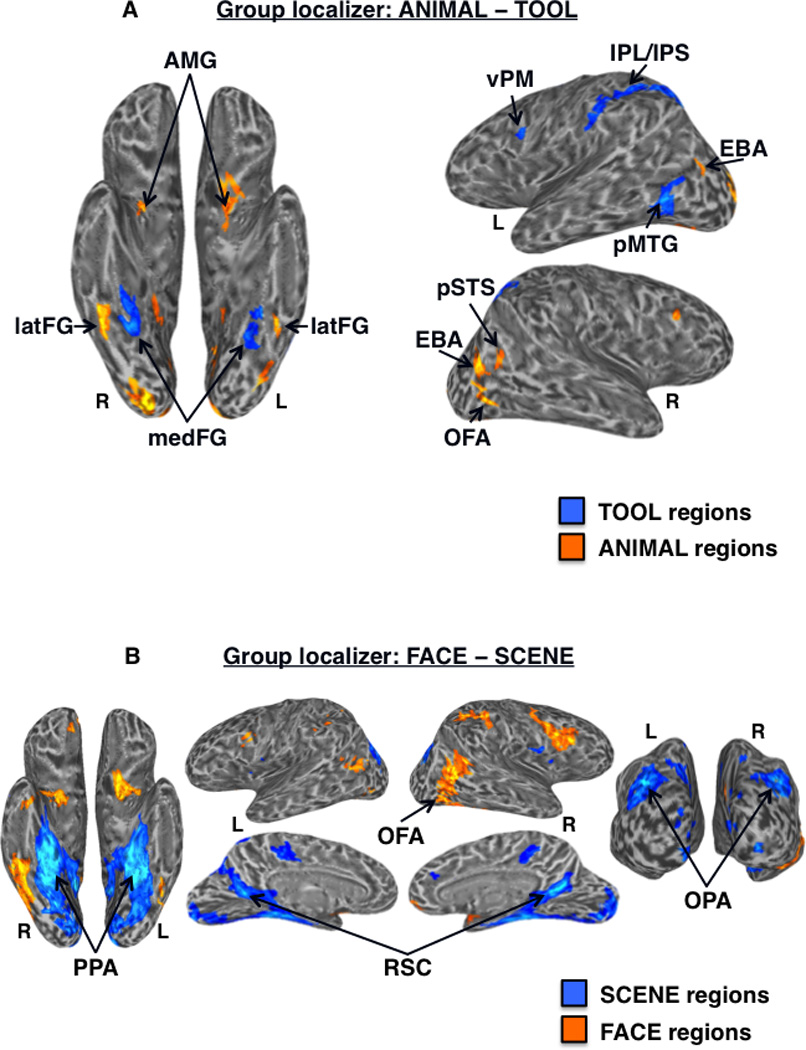
Figure 2.

Group-level functional localizer results. (A) Regions showing significantly higher activation for tools (cool colors) vs. animals (warm colors) in the functional localizer at the group-level (n = 33) displayed on partially inflated ventral (left) and lateral (right) cortical surfaces. TOOL regions included bilateral medFG (VOTC-TOOL) and left pMTG, IPS, IPL, and vPM; ANIMAL regions included bilateral latFG (VOTC-ANIMAL), EBA, AMG, and right OFA and pSTS. (B) Regions showing significantly higher activation for scenes (cool colors) vs. faces (warm colors) in the functional localizer at the group-level (n = 33) displayed on partially inflated ventral (left), lateral (top middle), medial (bottom middle), and posterior (right) cortical surfaces. SCENE regions included bilateral PPA, RSC, and OPA; the FACE region of interest was the right OFA. Activations are t-statistic maps displayed at node-wise threshold P < 0.001; whole-brain threshold P < 0.01, FDR corrected; minimum cluster size of 50 nodes. L, left; R, right.
