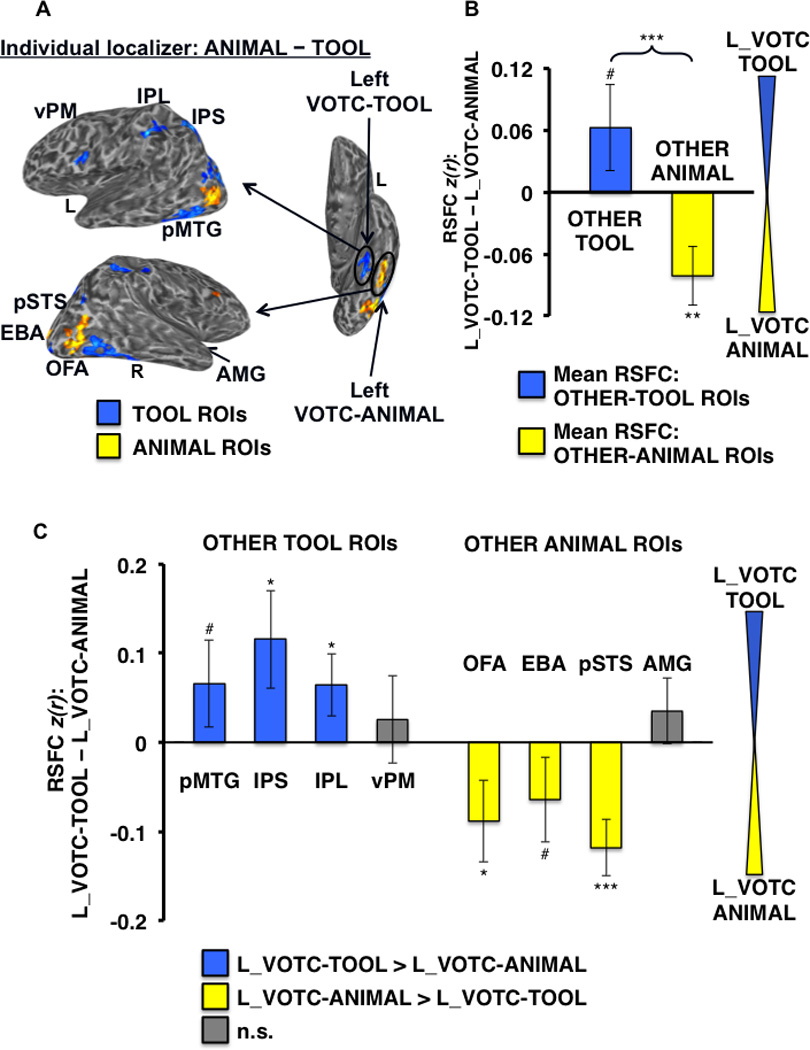
Figure 7.

Differential RSFC of left VOTC-TOOL region and left VOTC-ANIMAL region with OTHER-TOOL vs. OTHER-ANIMAL ROIs. (A) Example individual localizer results displayed on semi-inflated lateral (left) and ventral (right) cortical surfaces, as in Figure 4. Arrows depict the hypothesis that adjacent VOTC-TOOL and VOTC-ANIMAL regions within the left VOTC would show differentially stronger RSFC with OTHER-TOOL vs. OTHER-ANIMAL regions, respectively, when localized at the individual-level. Results of the within-hemisphere analyses at both the category-level (B) and individual ROI-level (C) are strikingly similar to the parallel cross-hemisphere comparisons (Fig. 5). *** P < 0.001; ** P < 0.01; * P < 0.05; # P < 0.1; n.s., not significant All other plots and labels are the same as in Figure 5.
