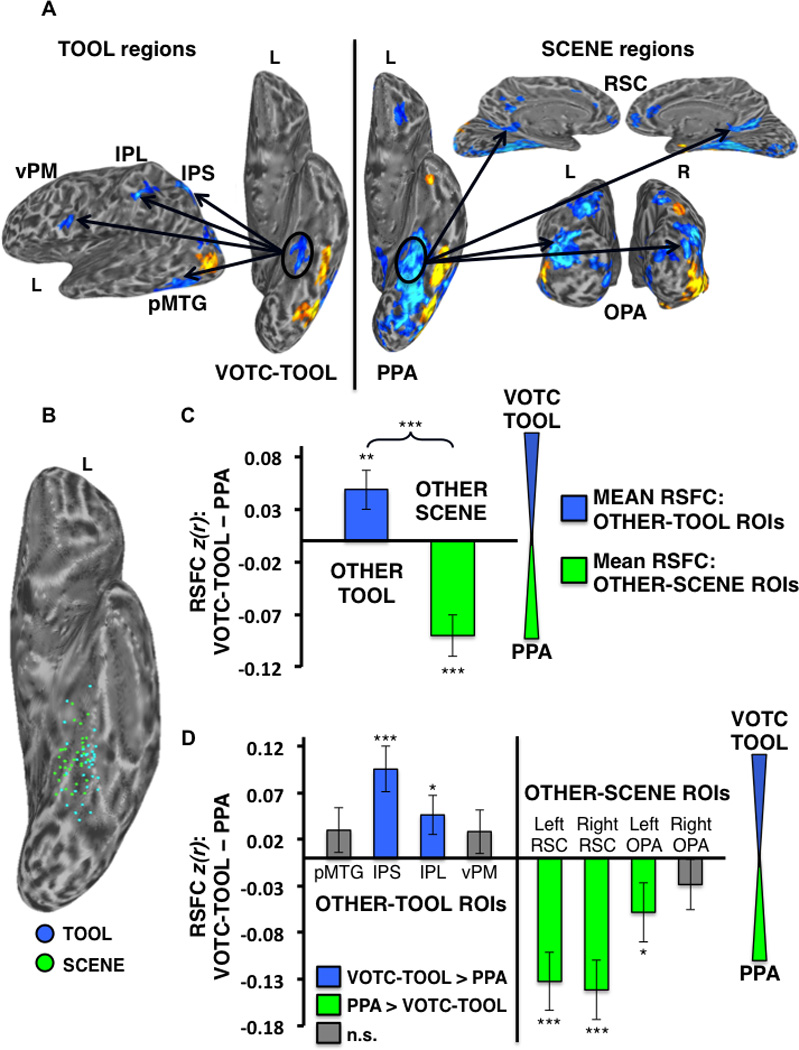
Figure 8.

Differential RSFC of the left VOTC-TOOL region and left PPA with TOOL vs. SCENE ROIs. (A) Example individual localizer: regions showing preferential activation for TOOLS (Contrast: TOOLS > ANIMALS; left) and SCENES (Contrast: SCENES > FACES; right) are displayed (cool colors) on semi-inflated lateral (left) ventral (middle), medial (top right), and posterior (bottom right) cortical surfaces. Activations are t-statistic maps displayed at node-wise threshold P < 0.001; wholebrain threshold P < 0.01, FDR corrected; minimum cluster size of 50 nodes. Arrows depict the hypothesis that, despite their proximal/overlapping locations, the VOTC-TOOL region and PPA would show stronger RSFC with OTHER-TOOL vs. OTHER-SCENE regions, respectively, when localized at the individual-level. (B) Scatter plot displays the overlapping spatial distributions of the locations of peak TOOL (blue dots) and SCENE (green dots) activations for all 33 subjects on the partially inflated left ventral cortical surface. (C) Category-level analysis: Difference between the mean RSFC of the OTHER-TOOL ROIs (left pMTG, IPS, IPL, and vPM) and OTHER-SCENE ROIs (bilateral RSC and OPA) with the left VOTC-TOOL region vs. left PPA; positive values indicate stronger mean RSFC with left VOTC-TOOL region; negative values indicate stronger mean RSFC with the left PPA. As predicted, the OTHER-TOOL regions showed relatively stronger mean RSFC with the VOTC-TOOL region; conversely, the OTHER-SCENE ROIs showed relatively stronger mean RSFC with the PPA. Brace indicates a significant VOTC-ROI (VOTC-TOOL region vs. PPA) by category (OTHER-TOOL regions vs. OTHER-SCENE regions) crossover interaction. (D) Individual ROI analysis: Difference between RSFC of the left VOTC-TOOL region vs. left PPA with each of the individual OTHER-TOOL and OTHER-SCENE ROIs; positive values (blue bars) indicate stronger RSFC with the VOTC-TOOL region; negative values (green bars) indicate stronger RSFC with the PPA; gray bars indicate no significant difference. As predicted, only OTHER-TOOL ROIs showed stronger RSFC with left VOTC-TOOL region, including the left IPS and IPL. Conversely, only OTHER-SCENE ROIs showed stronger RSFC with the left PPA, including bilateral RSC and left OPA. L, left; R, right; *** P < 0.001; ** P < 0.01; * P < 0.05; n.s., not significant. Error bars represent between-subjects s.e.m.
