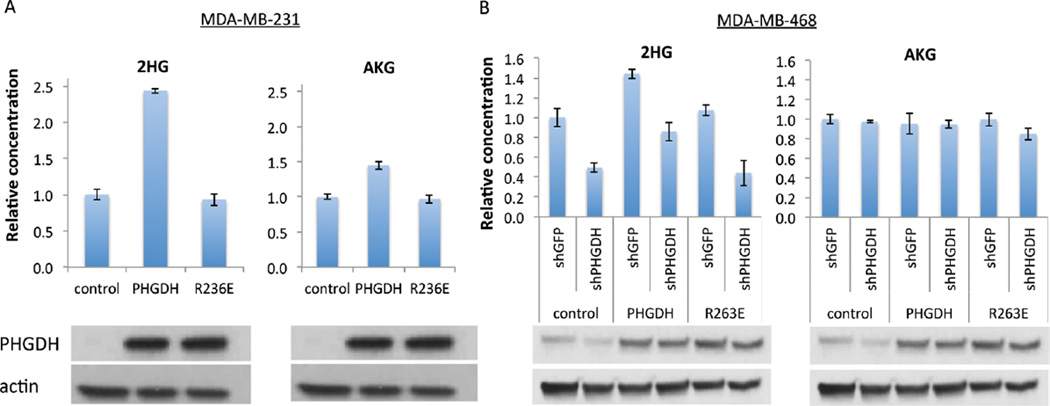
Figure 3.
Dependence of cellular 2HG concentration on PHGDH catalytic activity. (A) Relative concentrations of 2-HG and AKG in the non-PHGDH-amplified breast cancer cell line, MDA-MB-231, transfected with control vector, PHGDH, or catalytically inactive PHGDH (R236E). PHGDH expression by western is shown on the bottom. (B) Relative concentrations of 2-HG and AKG in MDA-MB-468 cells, with or without PHGDH knockdown, with catalytically active or inactive PHGDH re-expression. PHGDH expression by western is shown on the bottom. Mean ± SD, N = 3.

