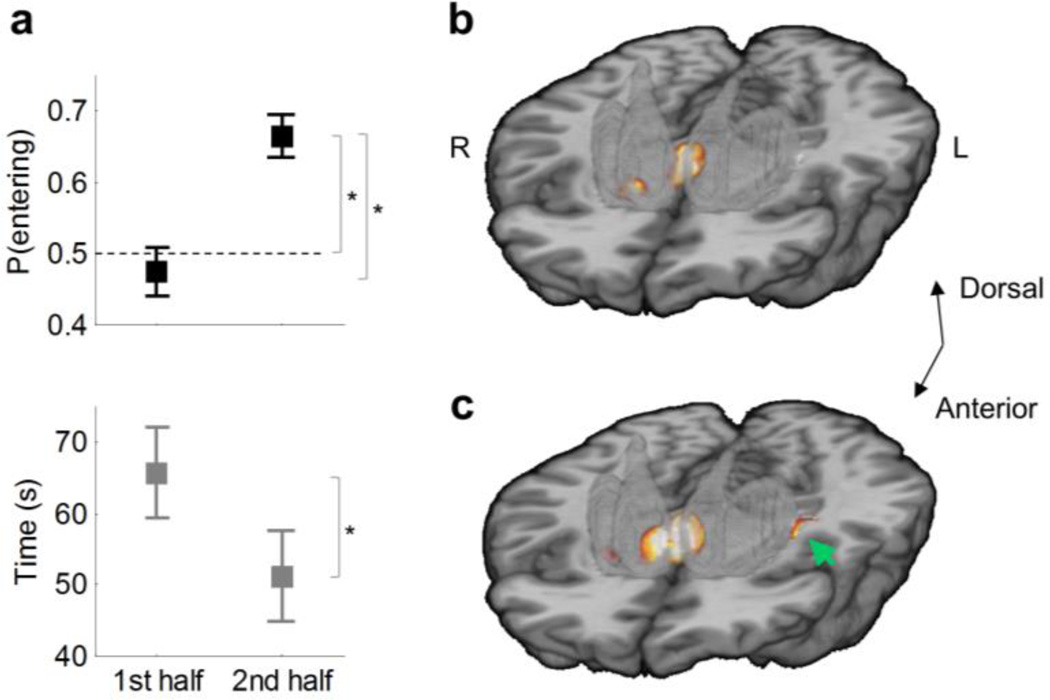
Fig. 3.
Behavioral and imaging findings for all participants (n=54). (a) Percentage of entering choices for lit arms (top) and time to obtain the rewards (bottom) in the first and second half of the run. Error bars represent s.e.m. Asterisks indicate statistically significant effects at P<0.05. The dashed line indicates chance-level performance. (b) Prediction error signal during outcome periods (hot colors) within the striatum in the ventral striatum and anteromedial caudate (caudate head). 3D template of the striatum (semi-transparent gray). (c) Q signal during choice periods (hot colors) in the ventral and anteromedial regions of the striatum and left posterolateral putamen (green arrow). Maps are thresholded at posterior probability (PP) ≥ 0.95. Figs. S2 and S3 present whole-brain results for the PE and Q signals, respectively.

