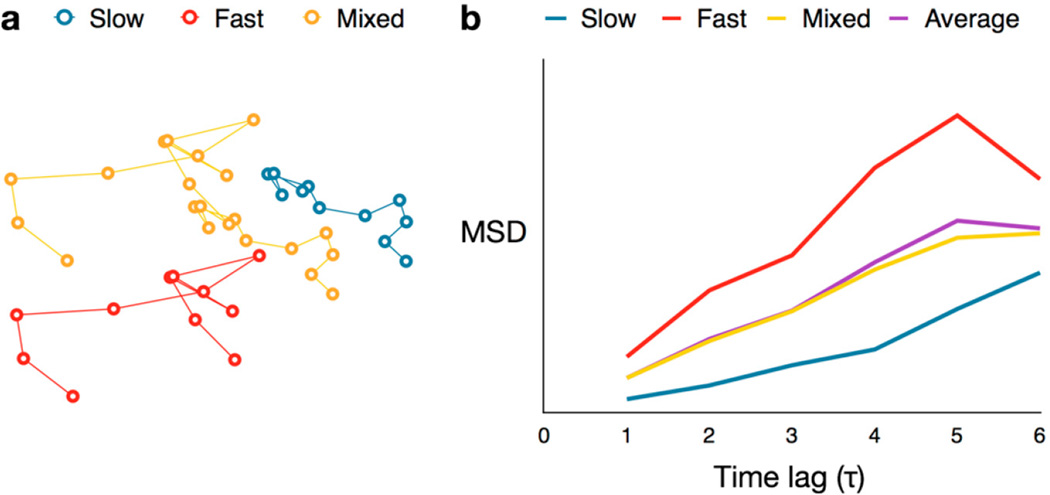
Figure 11.
MSD averaging effect. (a) Three simulated trajectories for molecules exhibiting fast diffusion (red) and slow diffusion (blue), and a combination of the two (yellow), respectively; (b) MSD curves for the three trajectories in (a), as well as the curve for the mean (purple) of the fast and slow MSDs.

