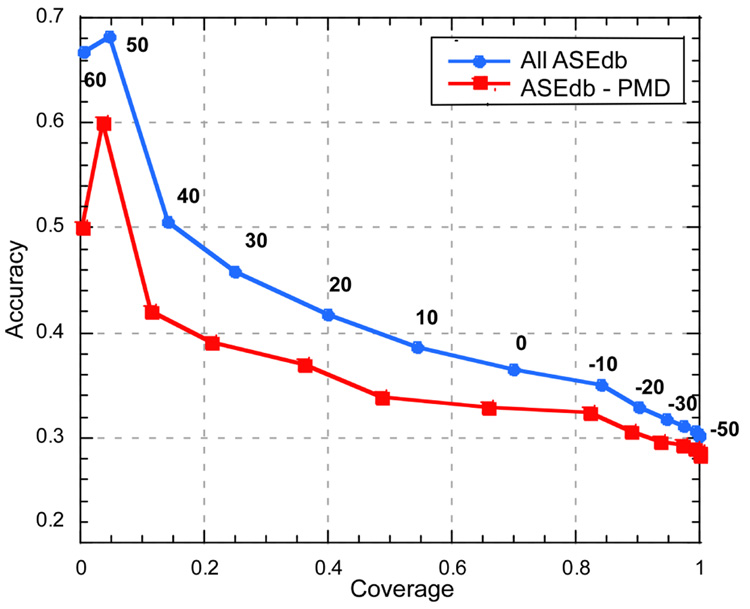
Figure 1. Variation of SNAP cutoff influences performance.
By varying the threshold in the SNAP output (−100 to +100) for considering a mutation as effecting function, we can dial through the ROC curve for interaction hot spots. On the one end, choosing a very low threshold we find all hot spots at very low accuracy (−50 on the lower right), conversely, at high positives we find few hot spots but those we find at high accuracy (50 at top left). Performance is slightly worse for the reduced data set where all mutants overlapping with PMD are removed; it is unclear which data set is better for estimating the method’s performance (Results). For the full ASEdb data set at thresholds >30, we find ~25% of the observed hot spots, and ~45% of the sites predicted at that threshold are hot spots. To compile accuracy we assumed that proteins have only one binding site and that was the one probed in ASEdb; the degree to which this statement is wrong describes the degree to which our method underestimated accuracy.

