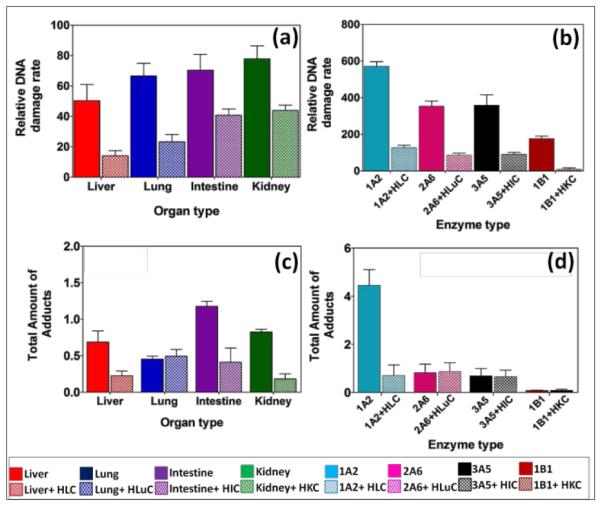
Fig. 3.

DNA damage rates and amounts of adducts from 2-AAF. Top panel - Relative DNA damage rate ({μg of protein}−1 s−1 mM−1) from ECL arrays exposed to 250 μM of 2-AAF in pH = 7.4 for (a) human organ tissue fractions, (b) cyt P450 supersomes. Bottom panel – Total amount of DNA adducts found (pmol {μg of protein}−1 {mM of 2-AAF}−1) after reactions with 250 μM 2-AAF at pH = 7.4 for 4 hrs, (c) human organ microsomes, (d) cyt P450 supersomes. The ECL images and single reaction monitoring LC-MS/MS chromatograms are in SI file (Figure S4 and Figure S7).
