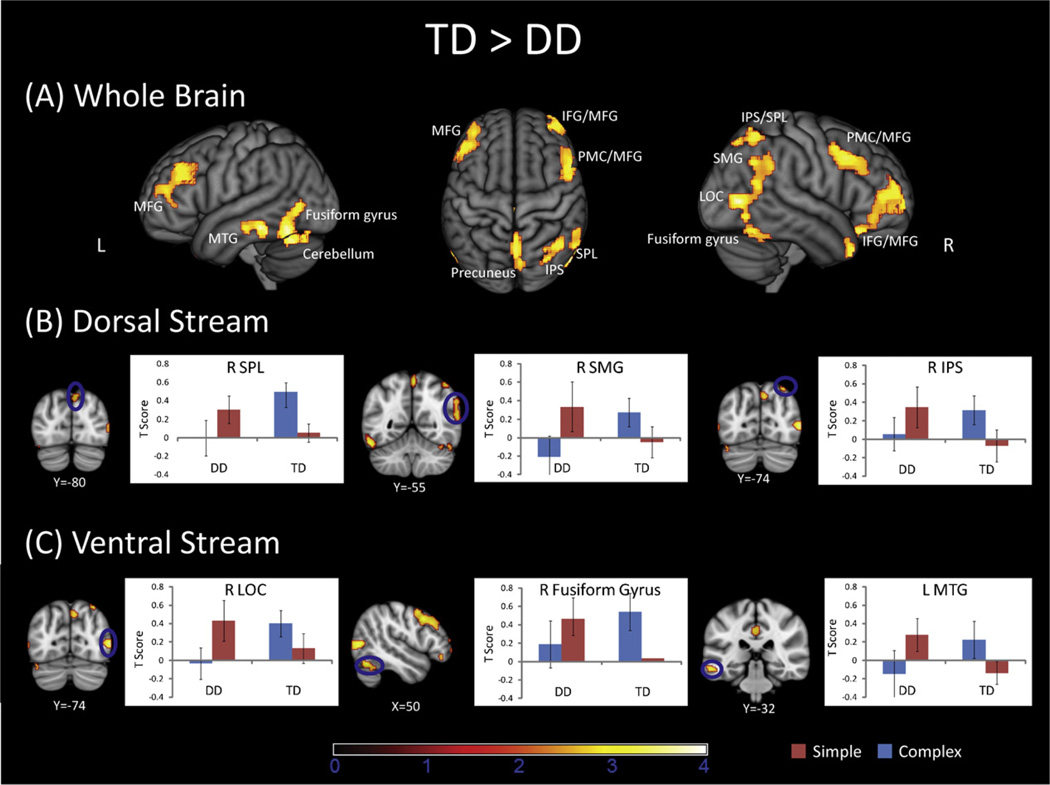
Fig. 3.
Comparison of dorsal and ventral visual stream responses in the DD and TD groups. (A) Surface rendering of brain areas that showed reduced complexity-related responses in the DD, compared to the TD, group. (B) The DD group showed reduced activation in the right superior parietal lobule (SPL, 44, −60 58), right supramarginal gyrus (SMG, 60, −52, 34), and the right intraparietal sulcus (IPS, 32, −74, 54). (C) The DD group also had reduced responses in the lateral occipital (LOC, 54, −74, 6), right fusiform gyrus (50, −62, −20), and left middle temporal gyrus (MTG, −60, −28, 14). Plots of signal levels in regional peaks shows that the TD group showed incresed activtity on Complex, compared to Simple, problems. In contrast, children with DD had simlar activation levels for Simple and Complex problems.

