Fig. 5.
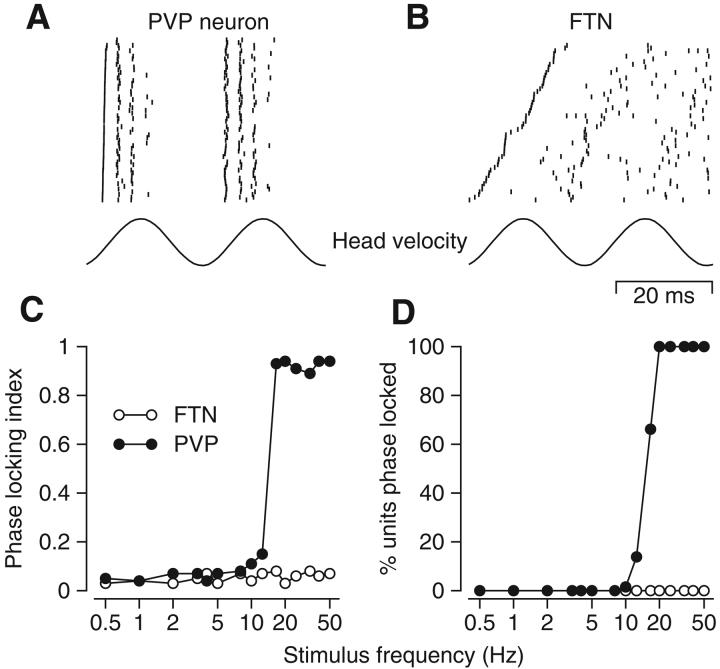
Phase-locking behavior of FTNs and PVPs at high frequencies of sinusoidal oscillation. A and B: rasters of spike responses on many cycles of VOR induced by oscillation at 20 Hz for an example PVP (A) and FTN (B). Bottom trace shows angular head velocity. The lines of the rasters are ordered from bottom to top according to the time of occurrence of the first spike in each cycle. Two consecutive cycles are shown to facilitate viewing of periodic events, but each cycle in the data contributed a first cycle to the analysis. C: phase-locking index as a function of stimulus frequency for one example neuron from each group. D: the percentage of each interneuron population showing phase locking as a function of stimulus frequency. In C and D, open and filled symbols show data for FTNs and PVPs.

