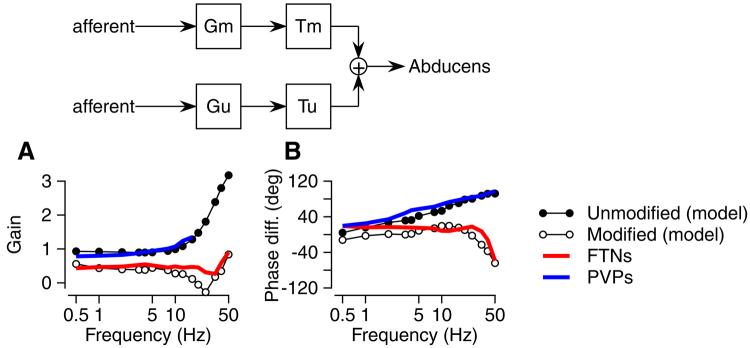
Fig. 7.
Comparison of the responses of FTNs and PVPs during the VOR with the predictions of a 2-pathway model of the VOR that took the responses of vestibular afferents as its inputs and predicted the responses of abducens neurons as its output. The inset at the top of the figure shows the model. Gx indicates the frequency-dependent gain of each pathway and Tx indicates the fixed time delay of each pathway, where “x” is “m” or “u” for the modified vs. unmodified pathway. A: predicted and actual gains for neurons in the unmodified and modified VOR pathways. B: predicted and actual phase shift with respect to head velocity as a function of stimulus frequency. Filled and open symbols show predictions for neurons in the unmodified and modified pathways, respectively. Red and blue curves show average responses for FTNs and PVPs, respectively.

