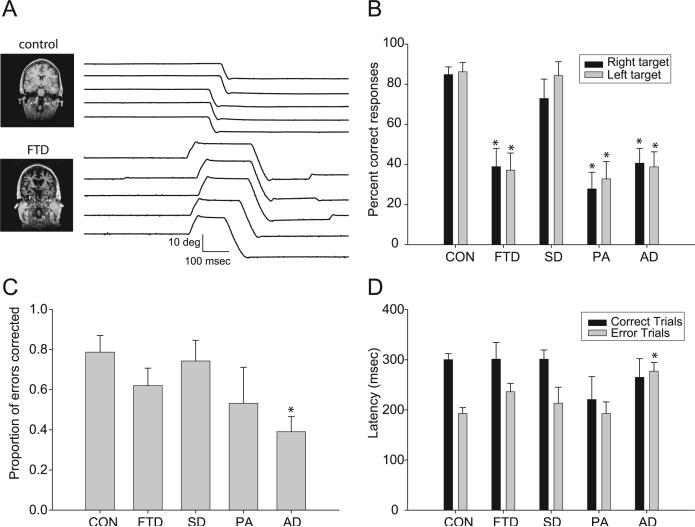
Figure 2.
Antisaccade performance in FTLD and AD. A, Eye position records showing examples of five consecutive antisaccade trials in a 53-year-old female control and a 54-year-old female FTD subject. A correct antisaccade response would have been a downward deflection of the eye position trace. Note the initial errors followed by rapid corrections in all five traces for the FTD subject.TheimagesattheleftofthepanelshowcoronalsectionsthroughthefrontalcortexfromT1-weightedMRIscans.B—D,Bar graphs summarizing antisaccade performance in controls (CON) and patient groups. In B and D, black and gray bars show responses to rightward and leftward targets. Error bars show SDs across subject within each group. Asterisks indicate effects that were statistically significant relative to controls ( p < 0.05). B, Percentages of correct antisaccade trials. C, Antisaccade error correction rates. D. Antisaccade latency.

