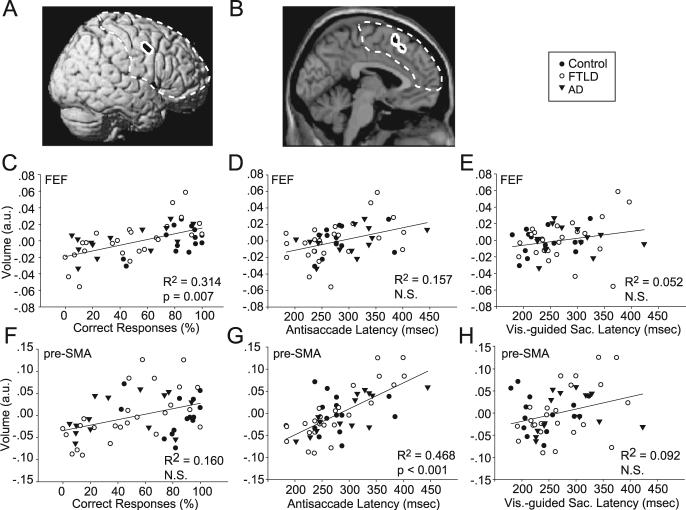
Figure 3.
Relationship between regional gray matter volume and saccade parameters. A, B, Structural images of frontal lobe regions using black patches surrounded by a white border to indicate where gray matter volume is correlated ( p<0.1, corrected for multiple comparisons, family-wise error) with percentage of correct antisaccade responses (A) or antisaccade latency (B) from the VBM analysis. Dashed line indicates region on which statistics are based. C—F, Scatter plots showing the relationship between gray matter volume and oculomotor performance, where each symbol shows measurements from a different subject. Filled circles, open circles, and upside down triangles show data from control, FTLD, and AD subjects. Brain volume is expressed in arbitrary units from the VBM analysis at the most significantly correlated voxel in the regions displayed in A and B. C—E show data for the right FEF region indicated in A (MNI coordinates: x = 61, y = 4, z = 42). F—H show data for the pre-SMA region indicated in B (MNI coordinates: x = 0, y = 19, z = 58). C, F, Percentage of correct antisaccade responses. D, G, Antisaccade latencies combined across directions. E, H, Visually guided saccade latencies in the overlap condition.

