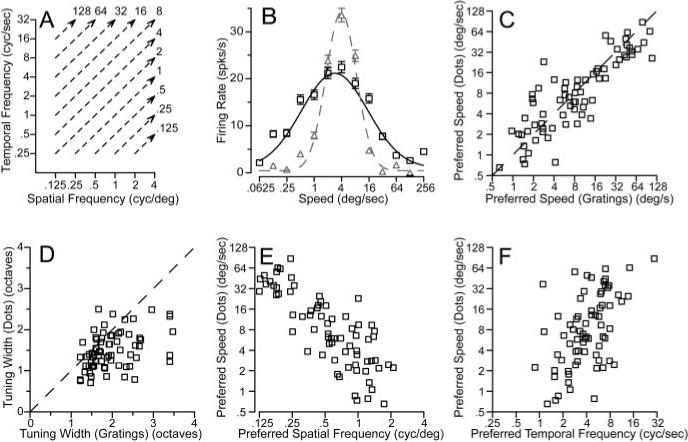
Figure 10.

Comparison of MT neuron responses to sine-wave gratings versus random-dot textures. A, A diagram of the method used to predict speed tuning for textures from response to gratings. For each speed of texture motion, the response of the neuron was averaged for sine-wave gratings that fell along the isospeed contours indicated by the dashed lines. B, Black versus gray symbols and curves show predicted and actual responses and turning curves from an example MT neuron as a function of texture speed. In C–F, each symbol shows measurements made from an individual neuron. C, D, Comparison of predicted and actual preferred speed (C) and tuning width (D) for the population of neurons. The dashed line shows the expected relationship if the predicted and actual tuning matched. The values plotted in these graphs were taken from the Gaussian curves fitted to the data for each neuron. E, F, Comparison of the preferred speed to random-dot textures with the preferred spatial frequency (E) or temporal frequency (F) for sine-wave gratings. Preferred spatial and temporal frequencies were obtained from the parameters that gave the best fits of Equations 2 and 3 to the data.
