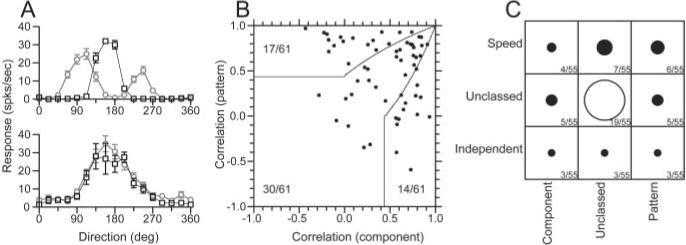
Figure 11.

Comparison of the responses of MT neurons to moving plaids with the degree of form-invariant speed tuning. A, Direction tuning of two example MT neurons for moving plaids and single sine-wave gratings. A, Top, Component-selective neuron; bottom, pattern-selective neuron. Black squares show the response to single sine-wave gratings, whereas the gray circles indicate the response to the plaid stimulus. Error bars indicate the SEM response for each direction of plaid movement. The plaid components were separated by 135°. B, The distribution of pattern versus component selective neurons, based on the correlation assay defined by Movshon et al. (1986). Solid lines indicate the basis for classification. The numbers indicate how the sample was distributed in each classification area. C, The joint distribution of classification for pattern selectivity (x-axis) and form-invariant speed tuning (y-axis). The diameter of each symbol, as well as the accompanying numbers, indicate the number of cells belonging to each joint classification. For speed tuning, the classification was taken from the analysis of the values of Q (Figs. 3, 4).
