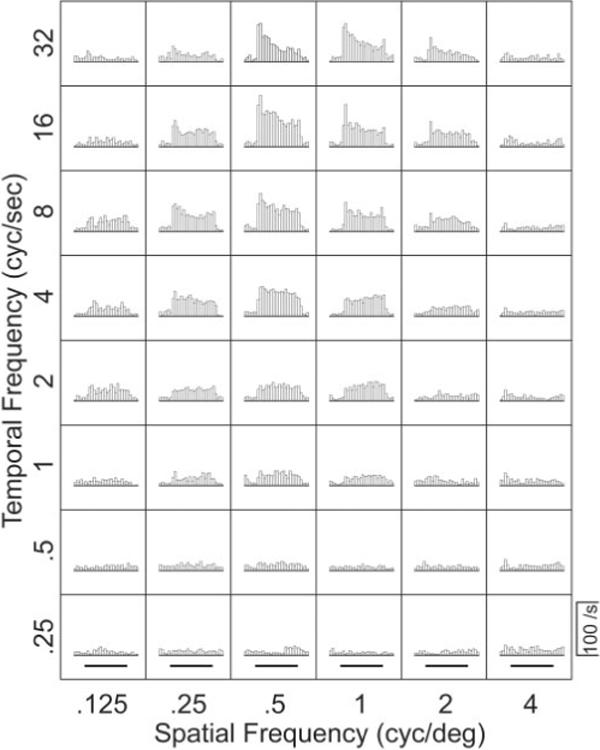
Figure 2.

Responses of a representative MT neuron to moving sine-wave gratings with different combinations of temporal and spatial frequency. Each histogram shows the average firing rate in 50 msec bins for multiple repetitions of a single stimulus. The grating was visible throughout each histogram, and the bold horizontal lines below the bottom row of histograms indicate the time when the grating was moving.
