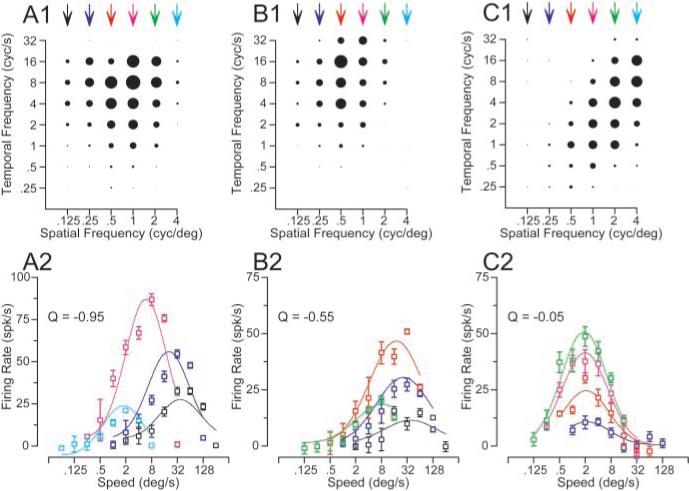
Figure 3.

Effect of spatial frequency on the preferred speed of three MT neurons chosen to indicate the diversity of effects. A1–C1, Response fields in the coordinate system of temporal and spatial frequency. Each symbol indicates the response to one combination of spatial and temporal frequency, and the diameter of the symbol gives the size of the response. A2–C2, Symbol splot the response of each neuron as a function of speed; the different colors indicate gratings of different spatial frequencies. Curves show the result of fitting the data with Equations 2 and 3. As before, the colors are coordinated for the symbols and curves in the bottom row of graphs and the arrows above the top row of graphs. Error bars indicate SEM of the firing rate.
