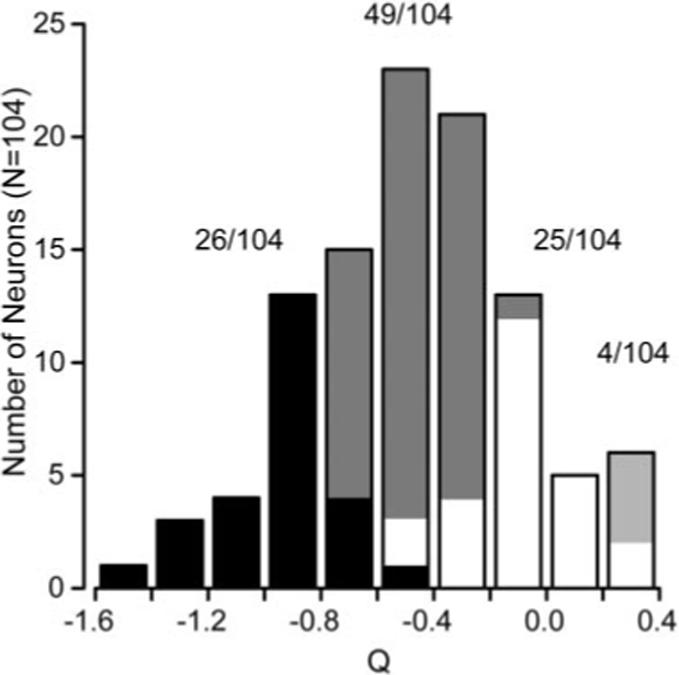
Figure 4.

Summary of the effect of spatial frequency on preferred speed across the population of MT neurons. The histogram plots the distribution of the value of Q (Eq. 2) for all 104 neurons in our sample. A Q value of −1 indicates spatial and temporal frequency independence. A Q value of 0 indicates no relationship between spatial frequency and preference for speed. The dark bars indicate neurons whose 95% confidence intervals for Q overlapped with −1. The white bars indicate neurons whose 95% confidence intervals for Q overlapped with 0. Gray bars indicate the neurons whose confidence intervals lie between −1 and 0, whereas the light gray bars indicate neurons whose Q values and confidence intervals were >0. The values above the corresponding portions of the histogram indicate the number of cells falling into each classification.
