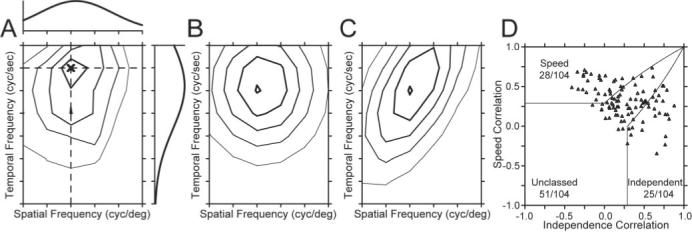
Figure 5.

Acorrelation-based analysis to classify the speed tuning of MT neurons (after Levitt et al., 1994). A, Contour plot of the response field of the example neuron shown in Figure 2 and Figure 3B1,B2. The spatial and temporal frequency that evoked the peak response is indicated by the dark X. The curve above the contour plot shows the spatial frequency tuning of the neuron at the temporal frequency that elicited the peak response, indicated by the horizontal dashed line. The curve to the right of the contour plot shows the temporal frequency tuning at the spatial frequency that elicited the peak response, shown by the vertical dashed line. B, C, Contour plots predicted by using the spatial and temporal tuning in A were used to create either a spatiotemporal-frequency-independent model of the neuron (B) or a speed-tuned model of the neuron (C). D, Summary of the correlation of the response field of each neuron with the predictions of models based on spatiotemporal independence (x-axis) and speed tuning (y-axis). Each symbol summarizes the classification for a different MT neuron in our sample. Solid lines indicate the dividing lines used to characterize neurons as speed-tuned, unclassed, or independent.
