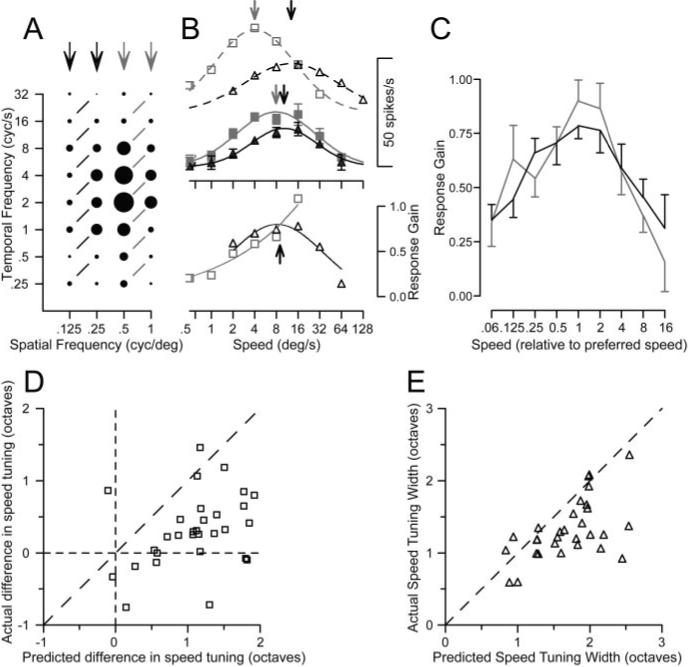
Figure 6.

Demonstration of a nonlinear mechanism that creates better speed tuning for dual gratings than for single gratings. A, Response field of an example MT neuron to single gratings of varying spatial and temporal frequency, as in Figure 3. The black and gray arrows indicate the spatial frequencies used for the two groups of dual grating stimuli. Responses connected by black or gray lines indicate dual-grating stimuli in which each grating provided motion at the same speed. B, Top, The open symbols and dashed curves plot the speed tuning predicted by the linear sum of the responses to individual gratings, for the spatial frequency pairs of stimuli in A comprising the lower (black) or higher (gray) frequencies. The filled symbols and continuous curves plot the actual speed tuning for dual gratings. Arrows plotted along the curves indicate the preferred speeds for predicted responses and the actual responses. B, Bottom, black and gray symbols plot the normalized gain of the response to dual gratings for the lower and higher ranges of spatial frequency pairs. The black arrow shows the mean of the preferred speeds for the actual responses over the two ranges of spatial frequencies. Gain was not computed for a given dual-grating stimulus unless the predicted response, in the denominator, was at least 10% of the maximum response. C, The population average of normalized response gain is plotted as a function of speed, in which the data of each neuron has been normalized so that preferred speed was 1. Black and gray curves show responses for low and high ranges of spatial frequencies. Error bars indicate SEM. D, Comparison of the actual and predicted difference in preferred speed between the dual-grating stimuli comprised of different pairs of spatial frequencies. Each symbol shows data for a single MT neuron. E, Comparison of the actual and predicted speed tuning for the dual grating stimuli. Each symbol indicates the tuning width for a single MT neuron. As detailed in Results, predicted responses were obtained by summing the responses to each component grating presented singly.
