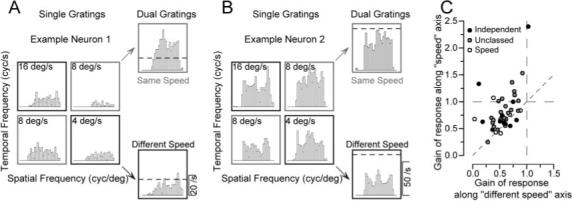
Figure 7.

Additional analysis of the nonlinear response to dual grating stimuli. A, B, Poststimulus time histograms showing the responses of two example neurons to both single gratings and dual gratings. In each panel, the four responses grouped in a square were obtained from single gratings with all combinations of two spatial and temporal frequencies. The numbers in each box indicate the speed of the stimulus. The two histograms at the top and bottom right of each panel show the responses to dual gratings composed of gratings moving at the same speed (gray boxes) or different speeds (black boxes). The dashed line shows the response level predicted by adding the mean firing to the two component grates presented alone. C, Group data for all 48 neurons whose responses were measured to dual gratings. Each symbol summarizes data from one neuron and shows the average gain of the response to same-speed dual gratings as a function of that for different-speed dual gratings. Gain is defined as the actual response divided by the linear prediction of the response. The filling of each circle indicates the classification of the neuron according to the effect of spatial frequency on preferred speed for single grating: black, independent; gray, unclassed; open, speed-tuned.
