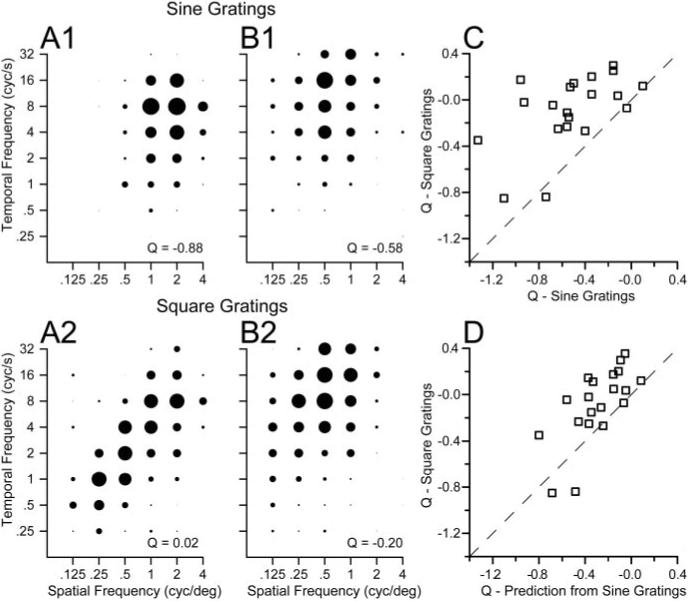
Figure 9.

Comparison of the effect of spatial frequency on preferred speed for sine-wave versus square-wave gratings. A1, B1, Spatiotemporal frequency response fields of two example MT neurons for high-contrast sine-wave gratings (32%), in the same format as Figure 3. A2, B2, Spatiotemporal frequency responses fields of the same two neurons for square-wave gratings. For each class of stimulus, the diameter of the symbols was normalized relative to the peak response for that stimulus. The numbers in the bottom right of each graph give the value of Q obtained by fitting Equations 2 and 3 to the data in that graph. C, Comparison of the values of Q for sine-wave versus square-wave gratings. D, Comparison of the values of Q fitted to the responses to square-wave gratings with those predicted by a linear sum of the responses to sine-wave gratings representing the frequency components in the square wave: the fundamental frequency (F) plus 3F, 5F, 7F, 9F, and 11 F. In C and D, each symbol summarizes the responses of an individual MT neuron and the dashed line has a slope of 1 and an intercept of 0.
