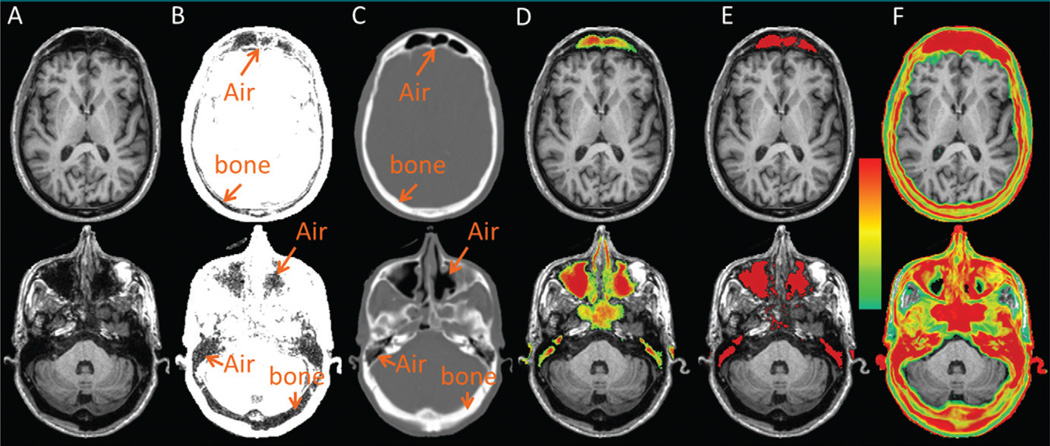
Figure 2.
Representative images obtained in a 71-year-old man at two axial section locations (separated into upper and lower rows): A, T1-weighted anatomic MR image, B, rescaled T1-weighted MR image, C, aligned CT image, D, probabilistic air map, E, candidate air space, and, F, CT standard deviation maps. The color bar represents an air probability range of 20%–100% for D and a CT number standard deviation range of 30–300 HU for F.

