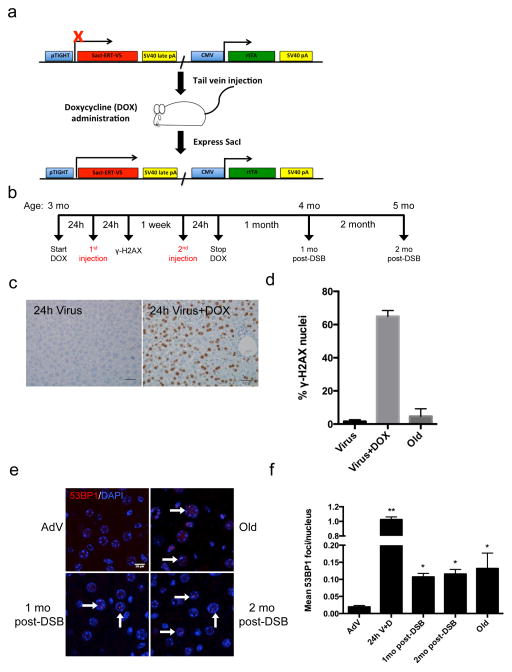
Figure 1. Double-strand break induction by SacI adenovirus.
(a) Schematic of the SacI adenoviral construct (SacI AdV) and its activation by doxycycline (DOX). (b) Schematic of the experimental timeline and mouse ages at which DSBs were induced. (c) Liver sections were immunostained for γ-H2AX 24 hours after SacI AdV tail-vein injection either without (left panel) or with (right panel) DOX administration, and old (28 month) mice as a control. Scale bar = 100μM. (d) Results were quantified and data shown as mean percentage of nuclei positively stained ± s.d,; Virus n=3, Virus+Dox n=2, Old n=3. (e) Representative images of liver sections stained with 53BP1 (red) and DAPI (blue), analyzed by confocal microscopy. White arrows indicate persistent 53BP1 foci. Scale bar = 10μM. (f) Mean number of 53BP1 foci per nucleus was quantified. Data shown are the mean ± s.e.m. of foci per nucleus, where AdV, 1mo, 2mo post-DSB n=4, 24h V+D n=2, and Old n=3; >300 nuclei were scored per animal. P values were calculated using student’s unpaired t-test to AdV samples. * P < 0.05, ** P < 0.01.

