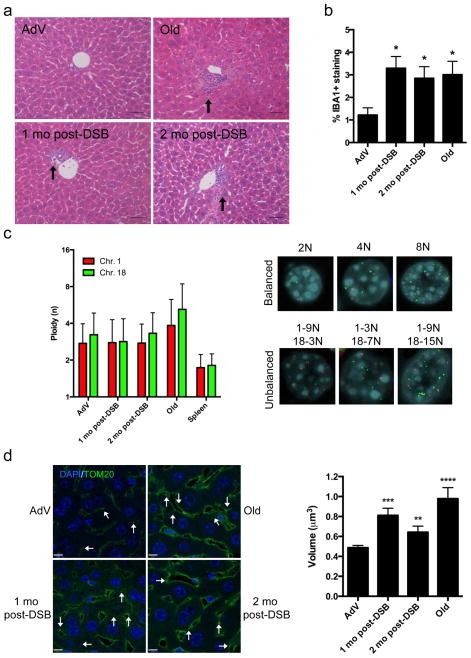
Figure 2. Phenotypic analysis of DSB-induced mouse liver.
(a) Representative H&E stained liver sections (portal vein orientation) assessed blinded for pathological characteristics of aging at 20X magnification. Black arrows indicate sites of lymphocytic infiltrates. (b) Quantification of activated macrophages determined by percentage of IBA1 staining. Data shown represents the mean ± s.e.m. from 3 images per n, where n=4 for all cohorts. (c) Dual-color interphase FISH was performed on liver sections. Ploidy for chromosome 1 (red) and chromosome 18 (green) was determined for 100 hepatocytes per n where n=3 for all cohorts. The ploidy of each chromosome was plotted as mean ± s.d. Representative images are shown for cells with balanced chromosome ploidy for 2N, 4N, and 8N and unbalanced cells. (d) Mitochondrial volume was quantified by immunofluorescent staining for TOM20 (green), a mitochondrial membrane bound protein, and nuclei (blue) and analyzed by confocal microscopy. White arrows indicate analyzable mitochondria after background noise subtraction from z-stack. Mean volume (in x-y-z planes) was calculated for 8 images per n (>2000 mitochondria), where AdV, 1mo, 2mo post-DSB n=4, and Old n=3. Data shown represents the mean ± s.e.m. Scale bar = 8 μM. P values were determined using the Kruskal-Wallis test to AdV samples followed by a post-hoc Dunn’s test. * P < 0.05, ** P < 0.01, *** P < 0.001.

