
Figure 1. The Effects of Terminal Disordered Segments on Protein Half-Life.
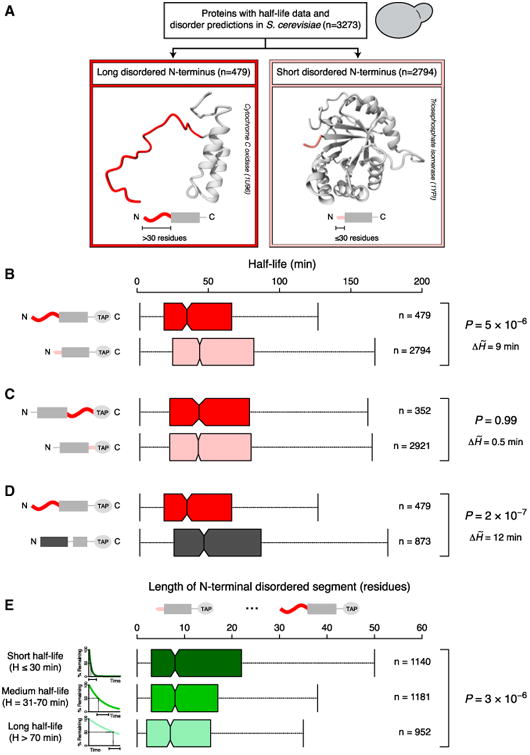
(A) A total of 3,273 yeast proteins were grouped based on the length of the disordered segment at the N terminus. Long (dark red) and short (light red) terminal disordered segments were defined as stretches of >30 and ≤30 disordered residues.
(B–D) Boxplots of protein half-life distributions. Proteins were classified based on the length of the disordered segment at the N terminus (B) or the C terminus (C) and the presence of N-terminal disordered or structured segments (D, long N-terminal structured regions [dark gray] were defined as >30 structured residues).
(E) Boxplots of the distributions of N-terminal disorder length for different half-life groups, indicated with schematic exponential degradation curves (from short half-life [dark green] to long half-life [light green]).
Central boxplot notches mark the median and the 95% confidence interval. Colored boxes represent the 50% of data points above (×0.75) and below (×0.25) the median (×0.50). Vertical lines (whiskers) connected to the boxes by the horizontal dashed lines represent the largest and the smallest nonoutlier data points. Outliers are not shown to improve visualization. p values reported are from Mann-Whitney U (B–D) and Kruskal-Wallis (E) tests. p values, the number of data points (n), and differences between the half-life medians of the ∼ compared groups (ΔH̃) are shown to the right.
See also Figures S1 and S3 and Table S1.