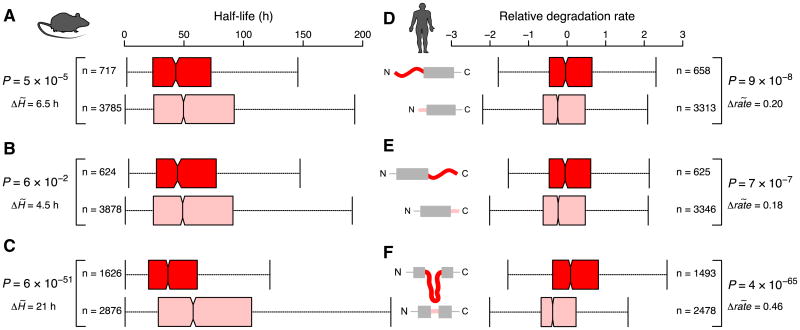
Figure 3. The Effects of Disordered Segments on Protein Turnover in Mouse and Human.
Boxplots of the distributions of half-life values in Mus musculus (A–C), and relative degradation rates in Homo sapiens (D–F), for proteins with long and short N-terminal, C-terminal, and internal disordered segments. Note that the scale for protein half-life is in hours for mouse, rather than minutes as in yeast. Values are reversed for the human data: proteins with a short half-life have a high relative degradation rate. See Figure 1 for further information. See also Table S5.

