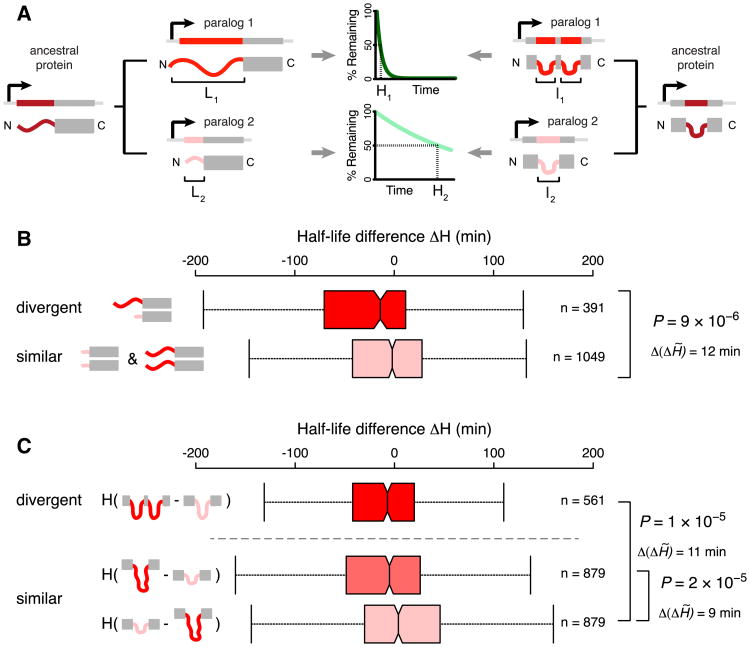
Figure 4. Divergence in Disordered Segments during Evolution Can Impact Protein Half-Life.
(A) Schematic depiction of how the half-life of paralogs could be altered by changes in N-terminal and/or internal disordered segments during evolution. The dark and light green degradation curves denote a short and long half-life. This schematic is not intended to cover all possible scenarios for divergence of disordered segments between paralogs.
(B) Distributions of half-life differences (ΔH) in pairs of yeast paralogs, grouped according to the difference in the length of their N-terminal disordered segments. Top: one paralog has a short and the other paralog a long disordered N terminus (SL). Bottom: both paralogs have short (both ≤30 residues; SS) or both have long (both >30 residues; LL) disordered N termini.
(C) Distribution of half-life differences (ΔH) in paralog pairs, grouped according to the difference in the number of internal disordered regions (ΔI). Top: pairs where one of the two paralogs has a higher number of internal disordered segments (ΔI ≥ 1). Bottom: pairs with identical numbers of internal disordered segment (ΔI = 0).
Each paralog pair is arranged so that ΔL = L1 − L2 (B) and ΔI = I1 − I2 (C) are always positive (i.e., L1 ≥ L2 and I1 ≥ I2). This order is used for the ΔH calculation (that is, the half-life of the paralog with the shortest N-terminal disorder, or the smallest number of internal disordered segments, will be subtracted from the half-life of the other one; ΔH = H1 − H2). As a result, ΔH will be negative for pairs where an increase in N-terminal or internal disorder coincides with a shorter half-life (Experimental Procedures). For ΔI = 0 (C, bottom), two ΔH distributions were obtained by ordering the paralogs within a pair according to the total length of all internal disordered segments (increasing and decreasing to simulate gain and loss of internal disorder length during evolution; Table S6A). See Figure 1 for further information. See also Figure S4 and Table S6.

