
Fig. 10.
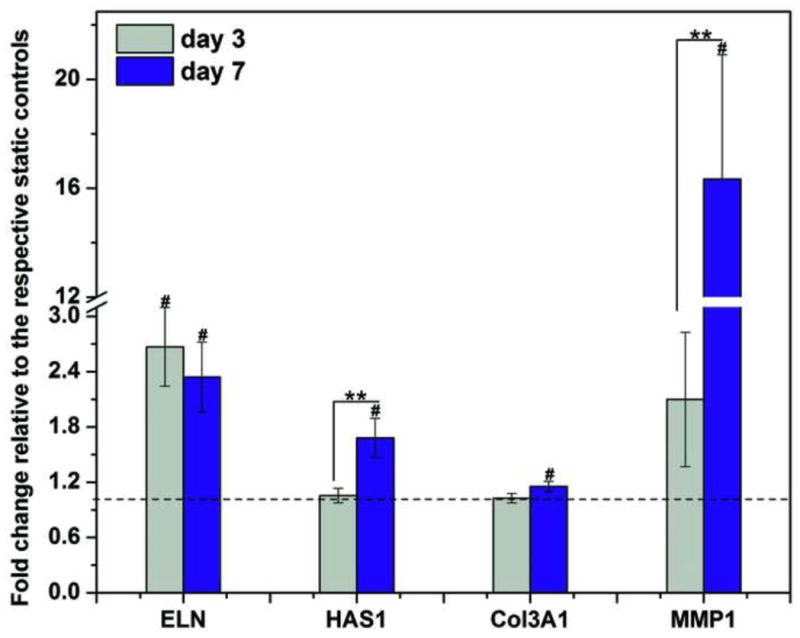
Cellular responses to the vibratory stimulations in terms of the expression of vocal fold relevant, ECM genes. The relative gene expression (fold change) is normalized to the respective static controls at day 3 and day 7 (dashed baseline). **: significant difference (p < 0.05) between day 3 and 7, #: significantly changed (p < 0.05) relative to the baseline. Data represents mean ± standard error of the mean (S.E.M, n=4). Two-tailed student’s t-test is used for statistical analysis, with p < 0.05 being considered as significantly difference (same as below). This figure has been modified from Tong et al.10 Copyright 2013, Mary Ann Liebert, Inc.