Figure 5.
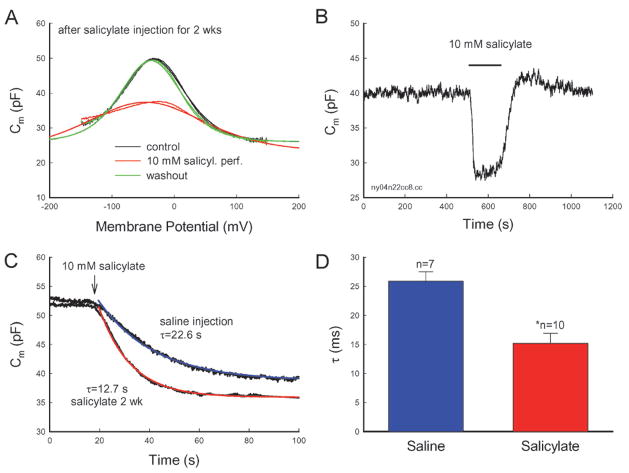
Acute inhibition of salicylate on OHC electromotility. (A, B) Acute inhibition of salicylate on OHC electromotility after long-term administration of salicylate. The OHC was isolated from a guinea pig injected with salicylate for 2 weeks. Salicylate (10 mM) was perfused during the patch-clamp recording. The NLC was reversibly eliminated. The smooth lines represent the data fitting to the Boltzmann function. The fitting parameters are Qmax: 3.05, 1.66 and 3.23 pC; z: 0.79, 0.4 and 0.76; Vh: −37.3, −46.1 and −33.7 mV; and Clin:26.1, 23.1 and 26.0 pF for control, 10 mM salicylate perfusion, and washout, respectively. (B) Continuous recording of the OHC capacitance. The horizontal bar represents the bath perfusion of 10 mM salicylate. (C, D) Long-term administration of salicylate speeds the acute inhibitory effect of salicylate on OHC electromotility. The smooth lines in (C) represent exponential fitting. An arrow indicates beginning of bath perfusion of 10 mM salicylate. An asterisk in (D) indicates p < 0.01 (t-test).

