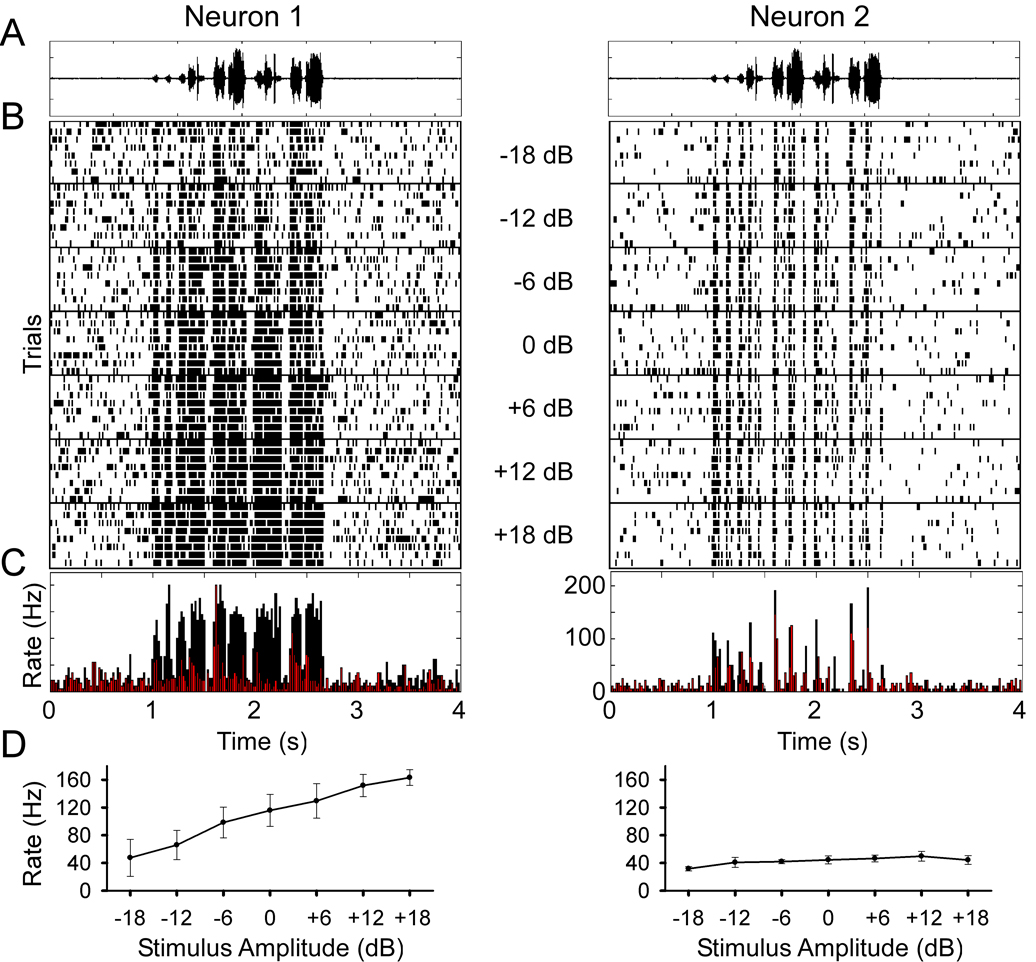
Figure 1.
Two example auditory neurons that show sensitivity (in left panels) and invariance (right panels) to stimulus intensity. At the top of the figure is A, the song waveform and B, below are stacked spike time rasters aligned in time with increasing amplitudes lower in the panel. A 6 dB increase in stimulus amplitude corresponds to a doubling of the amplitude. Each stimulus was presented randomly interleaved and the responses to successive stimuli are separated by a horizontal line. C, Overlay of the peristimulus time histograms for the lowest (in red) and highest stimulus amplitudes (in black). D, Plot of mean spike rate shows a significant increase in spike rate over the range of stimulus amplitudes (p < 0.001, one-way repeated measures ANOVA, error bars standard deviation of the mean) for neuron 1 and less variation in spike rates for neuron 2 although still significant (p < 0.001, one-way repeated measures ANOVA, error bars standard deviation of the mean).

