Figure 2.
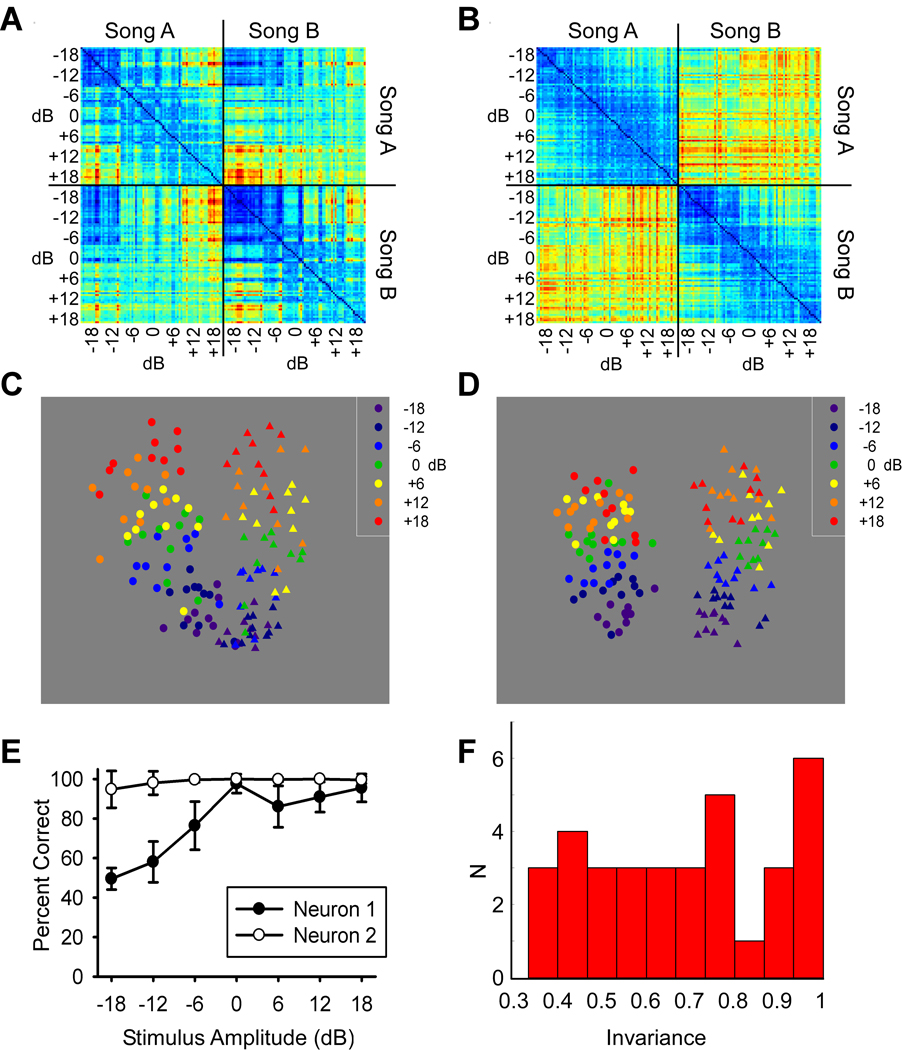
Auditory neurons show a range of invariant discrimination in Field L, the primary auditory cortex analogue. A, Spike distance matrix from the sensitive neuron shown in left panel of Figure 1. All pairwise spike distances shown for each of 10 trials, for 7 stimulus amplitudes, and 2 songs for a total of 140 spike trains. Spike trains 1 to 70 correspond to song A and 71 to 140 to song B. Spike distances were calculated using the van Rossum metric with a τ value of 10 ms using the first 1 second of each song. Warmer colors correspond to larger distances or more different spike trains. B, Spike distance matrix from invariant neuron shown in right panel of figure 1 using same parameters as in panel A. C, Multidimensional scaling (MDS) plot of relative spike distances in 2 dimensions for the sensitive neuron. D, MDS plot for the invariant neuron in same MDS axes as C. E, Percent correct classification of two songs as a function of song amplitude for both an invariant (Neuron 2) and a sensitive neuron (Neuron 1). Classification was done by measuring spike distance to two randomly chosen templates from the middle intensity (one from each song) and assigning the trial to the template with shortest distance. F, Histogram of measure of intensity invariance based upon flatness of percent correct curve for each of the 34 sites in this study from Field L that showed significant discrimination (better than halfway between chance and perfect) at any stimulus intensity. Larger numbers indicate more invariant discrimination.

