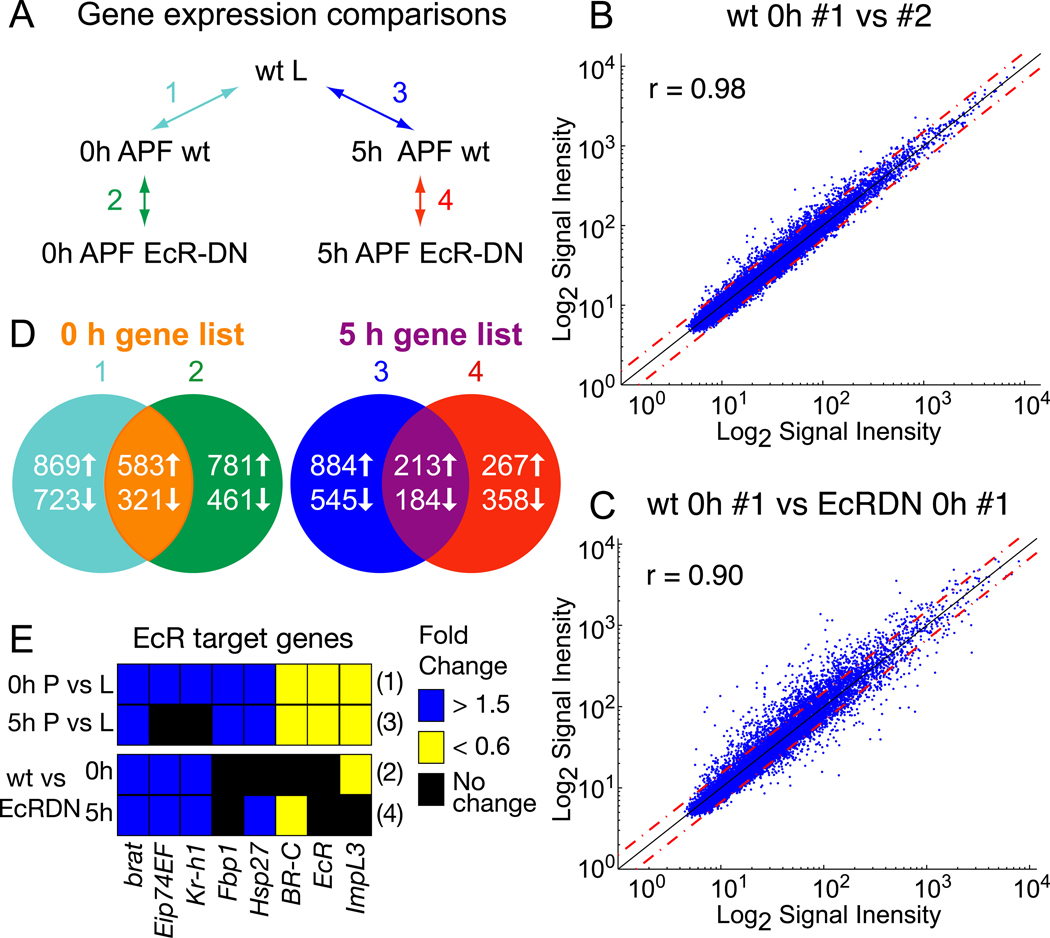
Fig. 1. Microarray analysis of ecdysone-regulated gene expression in MB γ neurons.
(A) Microarray experimental design. To assess changes in gene expression in MB γ neurons before and after the initiation of axon pruning we compared wt third instar larvae (L) 18 hours before puparium formation (BPF) with newly formed pupae at 0 hours and 5 hours after puparium formation (APF). Ecdysone-dependent changes in gene expression were assessed by comparing wt MB γ neurons with those expressing EcRDN at both 0 and 5 hours APF. All samples were laser captured from cryostat sections of brains expressing UAS-mCD8::GFP with OK107-GAL4 in the absence or presence of UAS-EcRDN.
(B) Normalized probe signal intensities for two biological replicates of wt γ neurons at 0 hours APF are plotted against each other. Red dashed lines represent a 1.5 fold difference in signal intensity. The degree of correlation between the two replicates is reflected by the Pearson’s correlation coefficient (r).
(C) Comparison of normalized signal intensities for individual samples from wt and EcRDN-expressing MB γ neurons at 0 hours APF.
(D) Venn diagram depicting the number of genes differentially expressed between the conditions outlined in (A) and the overlap between genes that show both developmental and EcR-dependent changes in expression at 0 or 5 hours APF (see Tables S1 and S2 for genes).
(E) Expression changes of a select subset of known ecdysone-regulated genes detected by microarray analysis. Fold changes in gene expression in pupal MB neurons at 0 or 5 hours APF (P) compared to larvae (L), or wt P compared to EcRDN P at 0 and 5 hours APF. Numbers to the right of the rows refer to the comparison from (A).

