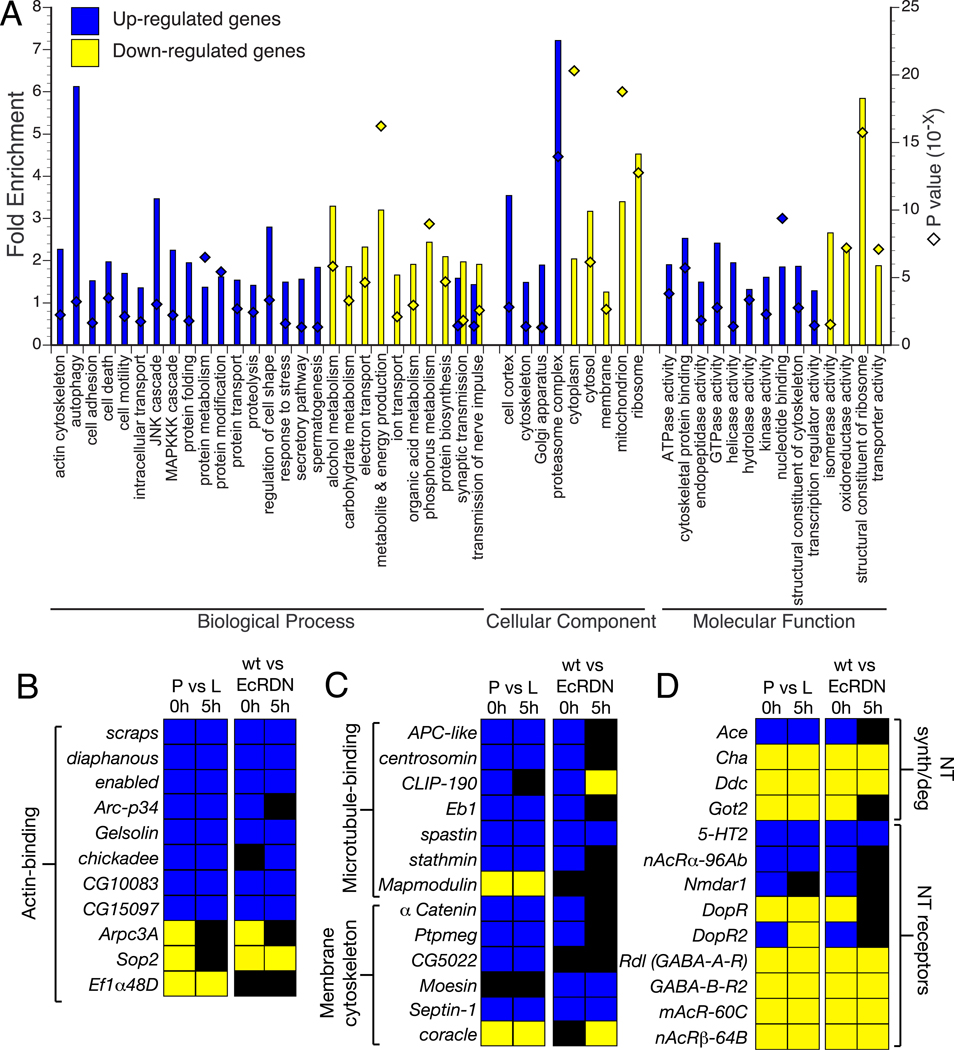
Fig. 2. Functional characterization of differentially expressed genes.
(A) Analysis of Gene Ontology categories for genes that show EcR-dependent up- or downregulation at 0 and/or 5 hours APF (composite of genes from the orange and purple regions of the Venn diagrams in Fig. 1D). The graph represents GO categories that are significantly over-represented (p < 0.05) in the two populations of differentially expressed genes. Bars indicate the fold enrichment (left Y axis) of the genes belonging to a particular GO term in the population of regulated genes, compared to the total population of genes on the DrosGenome1 array. Diamonds indicate the Modified Fisher’s Exact P-value (EASE score; right Y axis) for each category. Genes were classified by using a set of 179 GO categories for biological processes, cellular components and molecular function (GO essential slim; Tomancak et al., 2007). A given gene may belong to more than one group; see Tables S3 and S4 for details.
(B–C) Genes encoding actin-binding (B) and microtubule-binding proteins or proteins associated with the membrane cytoskeleton (C) are differentially regulated by EcR in MB neurons. Gene functions inferred from GO terms in Flybase and Goldstein et al. (2000). Color convention for fold expression change is the same as in Fig. 1E.
(D) Regulation of genes encoding neurotransmitter (NT) receptors, and proteins involved in NT synthesis and degradation. Gene function inferred from GO terms in Flybase.

