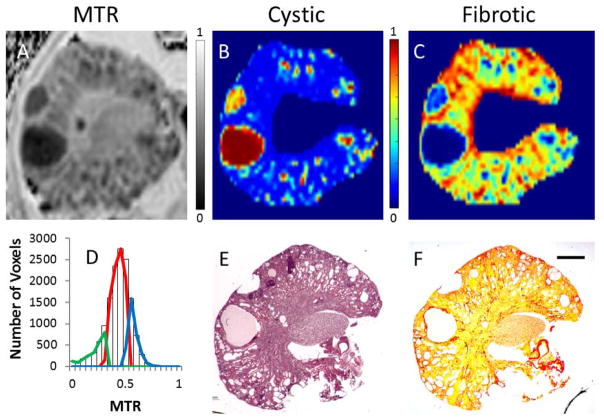
Figure 4.
Panel A: MTR map. Panel B: cystic probability map displaying cystic regions as red. Micro-cysts (sub-voxel) appear green (in this representation) due to voxel partial volume effects. Panel C: fibrotic probability map showing more fibrotic regions in green and red. For the corresponding panels, the color bar indicates the probability (or volume fraction) of each voxel to be cystic, or fibrotic - where blue indicates 0%, and red indicates 100%. Panel D: MTR histogram and GMM classification overlaid. Cystic tissue is conveyed by the green component, parenchyma as the red component, and fibrotic tissue as the blue component. Panel E: corresponding histological slice stained with H&E. Panel F: Picro-Sirius Red staining. The application of a three-tissue GMM approach to delineate both cystic (green) and fibrotic (blue) from normal healthy parenchyma tissue (red) was achievable in more severe cases such as this example (Panel D). The posterior probability maps for both cysts (comparing B–E) and fibrotic tissue (comparing C–F) correspond closely to the ground-truth observed in the histological slides. The scale bar is 1mm in length.

