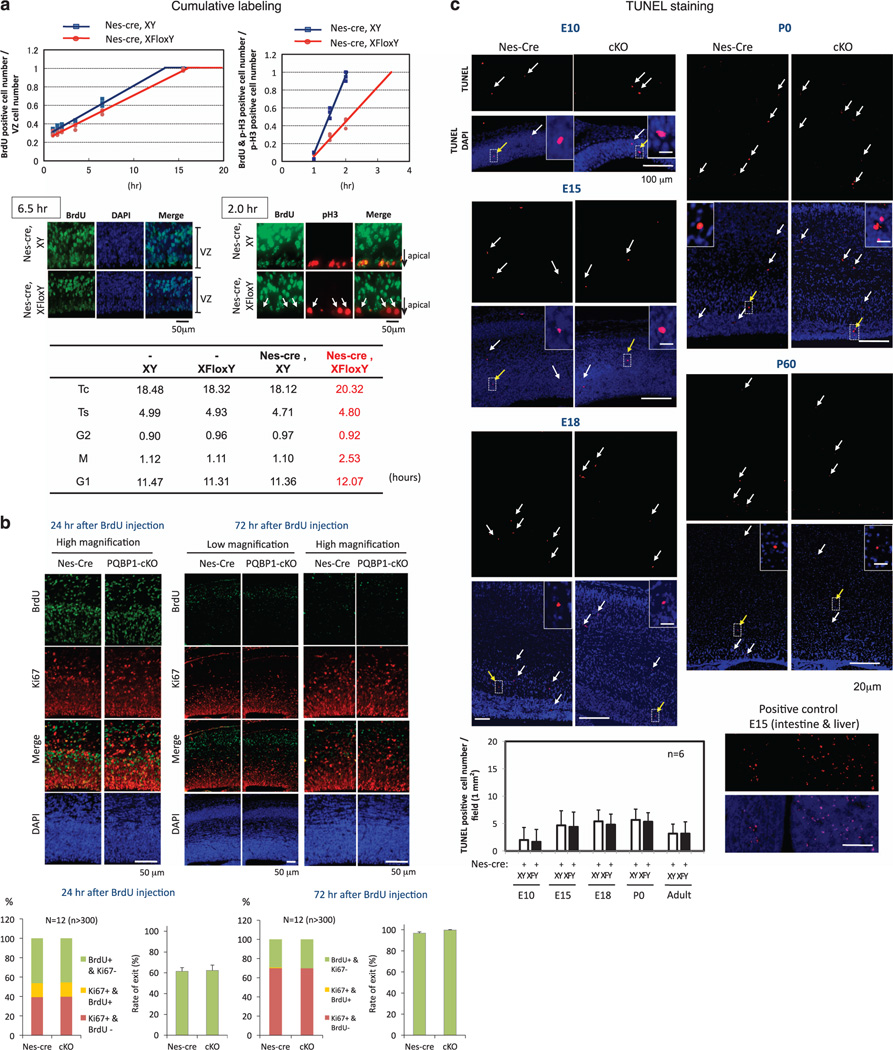
Figure 2. Nestin-Cre Pqbp1-cKO delays the cell cycle but does not affect neurogenesis of NSPCs.
(A) The M phase was specifically elongated in NSPCs of Pqbp1-cKO mice (Nes-Cre; XFloxY) in vivo. Cumulative labeling of NSPCs at E14 in vivo showed an increase in the total cell cycle length (Tc) of +2.2 hours, +12% (upper left panel). G2/M phase time was evaluated using phosphorylated histone H3 (upper right panel). The middle panels show immunostaining data corresponding to the upper panels. pH3+/BrdU+ cells were reduced in number in cKO embryos (arrows), indicating elongation of the G2/M phase (middle right panel). The summary of cumulative labeling and G2/M analyses is shown in the lower table. A significant extension of the G2/M phase (+67%) and a slight extension of G1 (+6%) were observed. The crossing point between the plot line and the x-axis indicates the length of G2 phase (upper right panel). Thus, the M phase was remarkably elongated while the length of the G2 phase was unchanged in Pqbp1-cKO mice.
(B) Neurogenesis from the stem cell pool was analyzed by co-staining for BrdU and Ki67. At 12 or 72 hours after intraperitoneal injection of BrdU, E15 embryonic brains were analyzed to calculate the numbers of cells after neurogenesis (BrdU+/Ki67−), cells remaining in the stem cell pool (BrdU+/Ki67+), and non-labeled stem/progenitor cells (BrdU−/Ki67+). The bar graphs show the relative percentages of the three groups (left graph) and the neurogenesis percentage of BrdU-labeled cells (right graph). No difference was detected at 24 hours and 72 hours after BrdU injection by the Student’s t-test or Welch’s t-test.
(C) Levels of cell death in the cerebral cortex were evaluated by TUNEL staining at E10, E15, E18, P0, and P60 of Pqbp1-cKO mice (Nes-Cre; XFloxY) and nestin-Cre mice (Nes-Cre; XY). Quantitative analysis of apoptotic cells did not reveal any differences (Student’s t-test).

