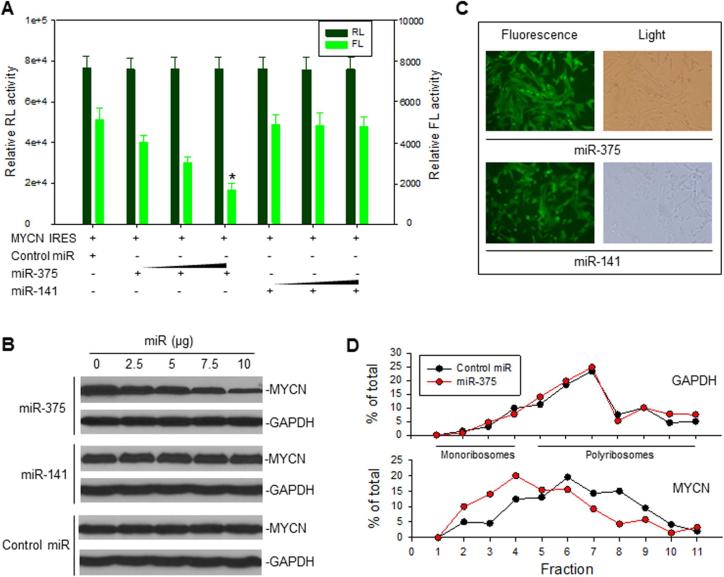
Figure 3.
The effect of miR-375 on MYCN IRES activity and MYCN protein expression. A, co-transfection of SK-N-SH cells with 5 μg MYCN IRES (pRL-100-FL) plasmid and increasing concentrations (50,100 and 200 nM) of oligo miR-375, miR-141 and control miRNA. Data represent the means (±SD) of RL and FL activities in three independent experiments, *p<0.01. B, transfection of MYCN-amplified NB-1643 cells with different dose of each miRNA in pCMV-miR vector as indicated for 24 h, followed by detection of endogenous MYCN expression by Western blot. C, representative pictures demonstrate that 100% of cells were transfected with the fluorescence-labeled pCMV-miR-375 and miR-141 expression plasmids. D, NB-1643 cells were transfected with miR-375 or control miR for 16 h and their cytoplasmic lysates were fractionated on a sucrose gradient. RNA was extracted from each of the fractions and subjected to quantitative RT-PCR for analysis of the distribution of MYCN and GAPDH mRNAs. Data represent the percentage of the total amount of corresponding mRNA in each fraction.

