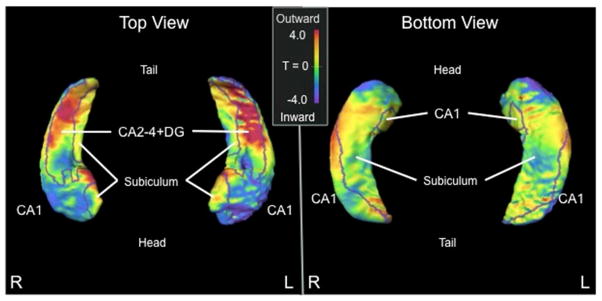
Figure 2. Shape comparison (T-score) between PPA vs. control subjects.

Cooler shades represent greater inward deformity of the PPA group relative to controls, while warmer shades represent greater outward deformity of the PPA group relative to controls. Borders on the surfaces indicate the CA1, subiculum, and CA2-4+DG subfield divisions.
Abbreviations: PPA, primary progressive aphasia; CA2-4+DG, CA2, 3, 4 and dentate gyrus
