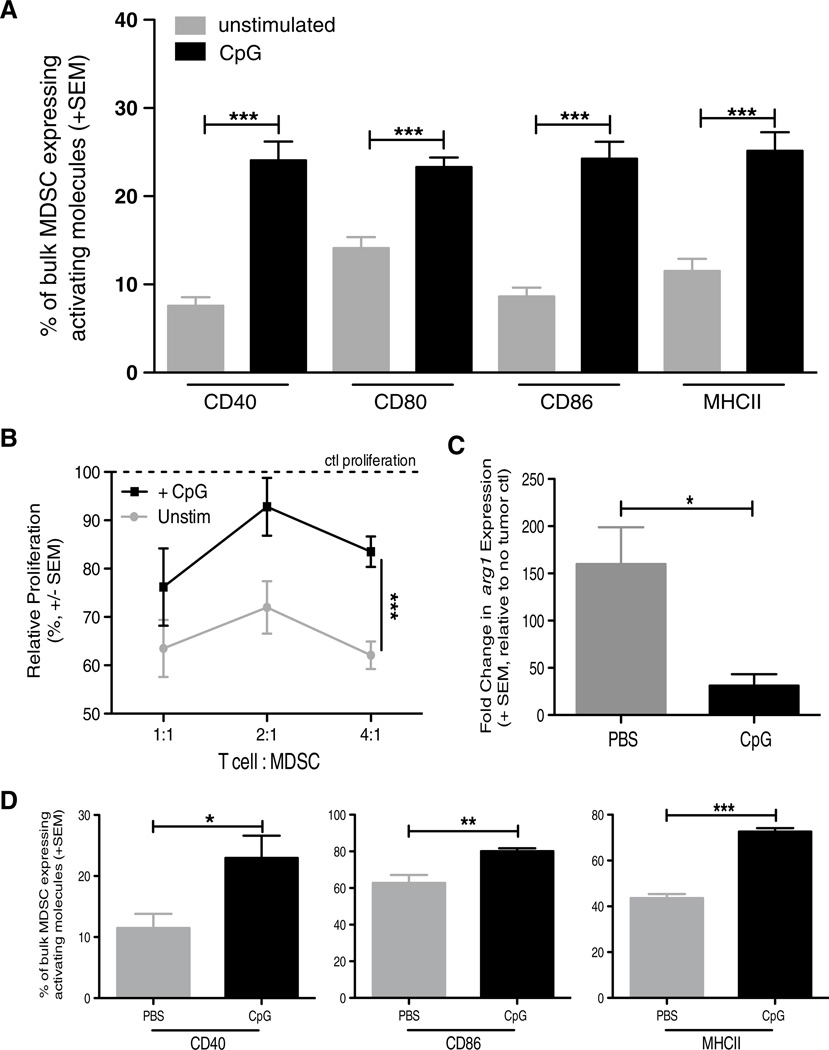
Fig. 5.
CpG alters MDSC phenotype and function in vitro and in vivo. BALB/c mice were implanted IR with 2 × 10⁵ Renca, and tumor-bearing kidneys and spleens were harvested days 18–21. a Splenocytes were plated at 106 cells/well in a 24-well plate. Cells were either treated with 100U of IFN-γ or 6 µg CpG overnight. Cells were harvested from plate and stained for flow cytometric analysis. a Mean (± SEM) frequency of CD3−CD19−CD11c−CD11b+Ly6C+ MDSC expressing high levels of CD40, CD80, CD86, MHC II. Data are representative of three independent experiments with at least 4 mice/group/experiment. b Mean (± SEM) proliferation of naïve WT BALB/c splenic CD8+ T cells stimulated with 1 µg/ml anti-CD3 mAb and cocultured with CpG-stimulated bulk MDSC. Ratios represent #CD8+ T cells: #MDSC. Cocultures were pulsed with [3H] thymidine during the last 18 h of incubation to assess proliferation. Data are representative of two independent experiments in which samples were each run in triplicate, ***p ≤ 0.001 using 2-way ANOVA. c qPCR analysis of arg1 expression in Renca-bearing kidneys 4 h after injection of PBS or CpG. d BALB/c mice were implanted IR with 2 × 10⁵ Renca and treated with CpG alone or PBS on day 7, and tumor-bearing kidneys were harvested day 12. Single-cell suspensions were made and stained for flow cytometric analysis. Mean (± SEM) frequency of MDSC expressing high levels of CD40, CD86, and MHC II. Data are representative of two independent experiments with at least 4 mice/group/experiment. For all experiments (except where noted), *p ≤ 0.05, **p ≤ 0.01, ***p ≤ 0.001 using Student’s t test

