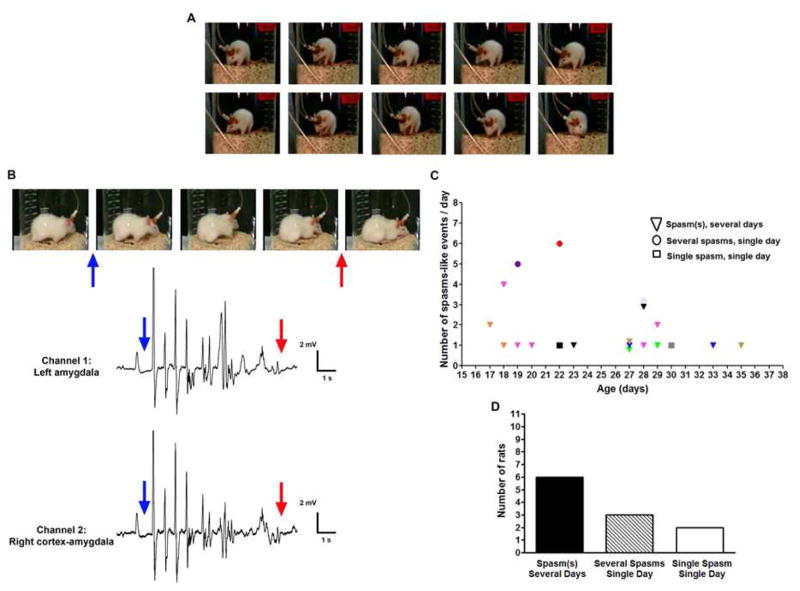
Fig. 3.
CES provokes flexion events resembling human infantile spasms in 11/23 rats. (A) Serial still images from a video recording of a CES rat cortical electrodes. These images depict the onset and progression of two consecutive spasm–like behaviors: In the event in the top row, note the body flexion of the rat. The sustained, slower phase of this flexion is more apparent in the spasm-like seizure shown in the bottom row. (B) Correlation of spasm-like behaviors and EEG in a different rat, with electrodes within the amygdala. The blue arrow points to the concurrent onset of behavioral flexion and epileptiform discharges. The behavioral event ends at the time noted by the red arrows. (C–D) Temporal and quantitative distribution of spasm-like events among rats. In C, each animal is represented by a symbol and color; the X axis is the age of the rat, in days, and the Y axis is the number of spasms for each days. Triangles denote rats who had multiple spasms over multiple days. These were the majority (6/11), as is depicted in (D). Circles denote rats (n = 3) that had several spasms during a single recording day, and squares denote two rats in whom only a single spasm was captured. Note that rats were recorded for only 1–2 hours per day prior to weaning, and thus the actual number of spasms was likely much higher. (D). The majority of rats had flexion, spasm-like events multiple times over several days.

