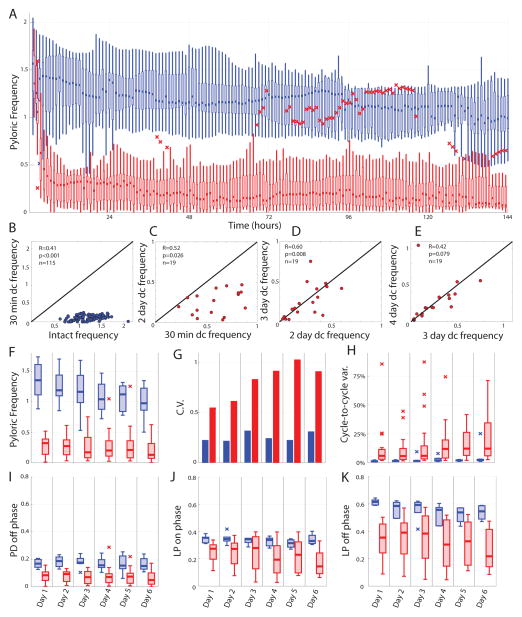
Figure 4.
Long-term population effects of decentralization on the pyloric rhythm. A. Population data for intact (n=9) and decentralized (n=19) preparations is shown for the first six days in culture. Data are plotted as box-plots (see methods) for each hour; data from intact preparations are shown in blue while decentralized preparations are shown in red. B–E. Cycle frequency correlations within preparations across time (dc, decentralized). Black diagonal line represents unity. Insets report R- and p-values of Pearson correlations. B. Following decentralization, all preparations exhibit a lower pyloric cycle frequency. C. All examined preparations also exhibit a lower frequency on the second day following decentralization (average frequency, 24 to 48 hours). D,E. On subsequent days, preparations are more correlated, and show an equal tendency to increase or decrease frequency. F–K. Measures of frequency (F), across-preparation variability (coefficient of variation, G), within-preparation variability (H), and pyloric phase relationships (I–K) are plotted for intact (blue) and decentralized (red) preparations. Box-plots are created from population data consisting of the average value for each preparation in 24-hour bins following decentralization.

