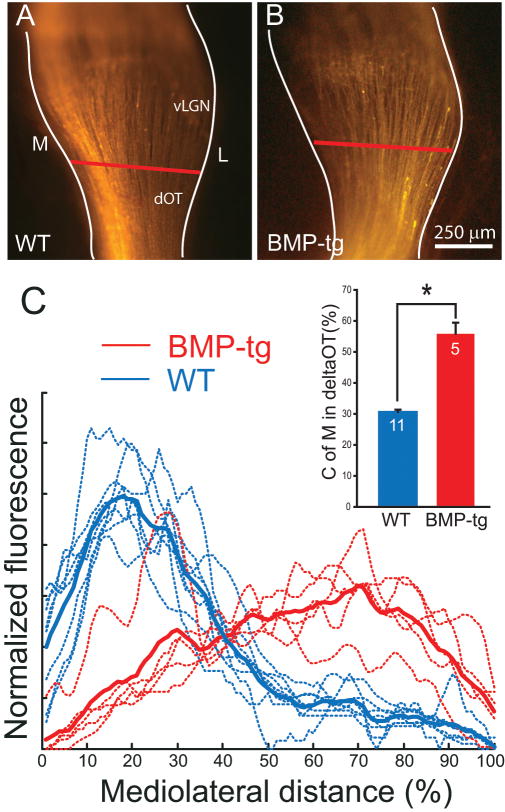
Figure 5.
Axon sorting even at P1 is disturbed in BMP-transgenic mice. A and B. Axon label from ventral retina is segregated to medial (M) optic tract by P1 in WT mice but already extends into lateral (L) optic tract in BMP transgenics at P1. C. The distribution of ventral label in the optic tracts of the two genotypes is quite different (BMP-transgenic is red; WT is blue; Dashed lines are example fluorescent profiles, solid lines are average fluorescent profiles). Each curve corresponds to the distribution of fluorescent label across the dOT (red bar in Fig. 5A and 5B) in one animal. Note that the fluorescent profiles for ventral retinal axons in BMP-transgenic mice (red) are not sorted to the medial optic tract, as they are in WT mice (blue). Summary quantification (inset) for the center of mass of fluorescent label in the dOT in P1 WT (blue; n=11) and BMP transgenic (red; n=5; *, p << 0.001) mice.

