
Figure 3. Process networks of erlotinib-resistant HNSCC cells.
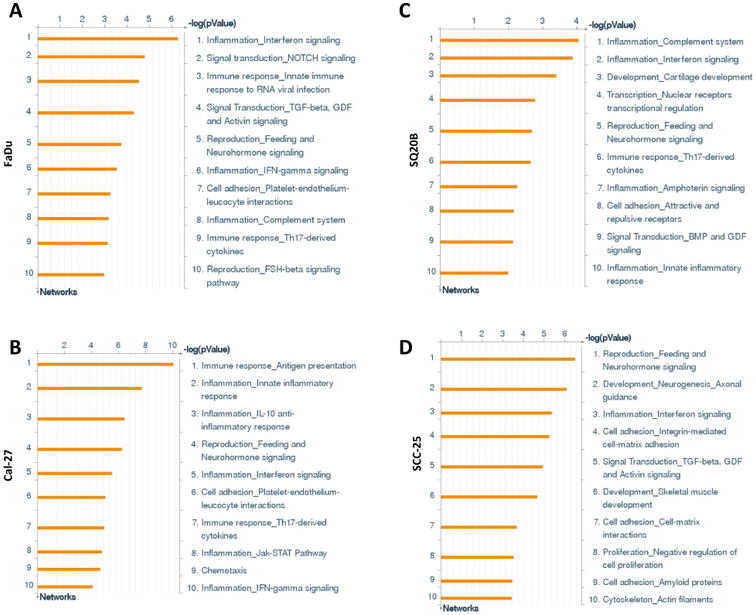
Shown are the top ten upregulated cellular/molecular processes from differentially regulated transcripts comparing microarray data from erlotinib-resistant FaDu, Cal-27, SCC-25 and SQ20B HNSCC cells versus their respective erlotinib-sensitive cells.