
Figure 4. Network analyses of erlotinib-resistant HNSCC cells.
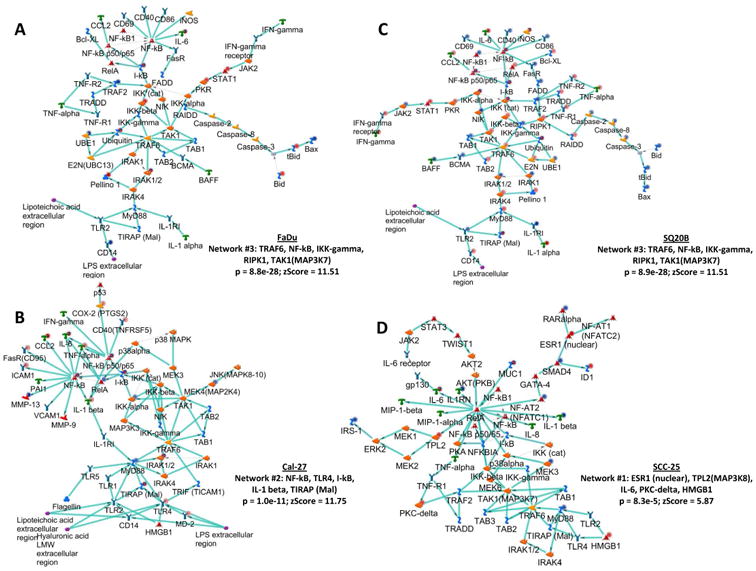
Shown are the top upregulated pro-inflammatory networks from differentially regulated transcripts comparing microarray data from erlotinib-resistant FaDu, Cal-27, SCC-25 and SQ20B HNSCC cells versus their respective erlotinib-sensitive cells. Up regulated genes are marked with red circles; down regulated with blue circles. The ‘checkerboard’ color indicates mixed expression for the gene between cell lines.