
Figure 5. Differentially expressed genes in erlotinib-resistant HNSCC cells.
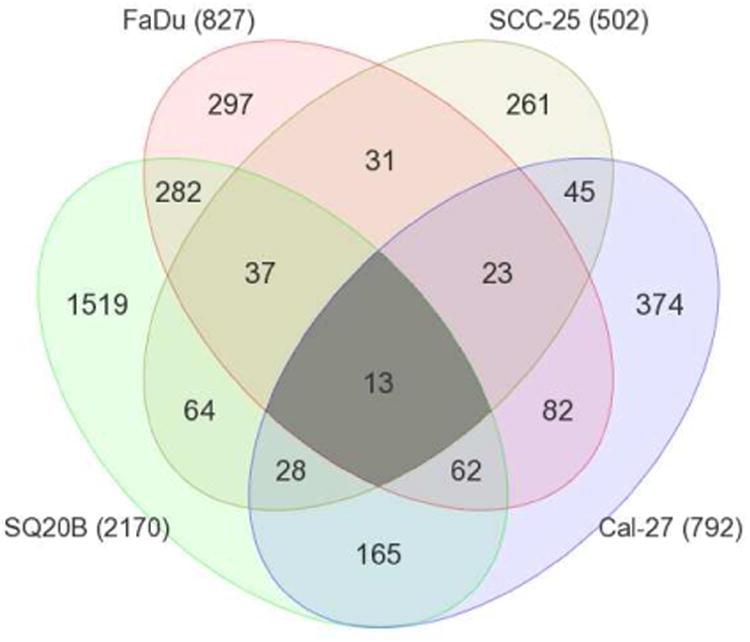
Venn diagram shows the number and overlap of differentially expressed genes in erlotinib-resistant FaDu, SQ20B, Cal-27, and SCC-25 HNSCC cells compared to their parental erlotinib sensitive cells. Numbers in parentheses represent the total number of differentially expressed genes in the indicated erlotinib-resistant HNSCC cells.