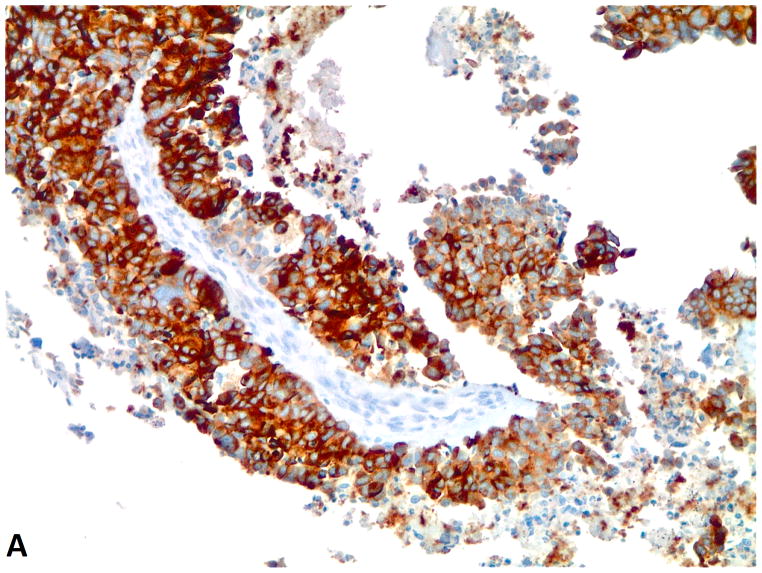
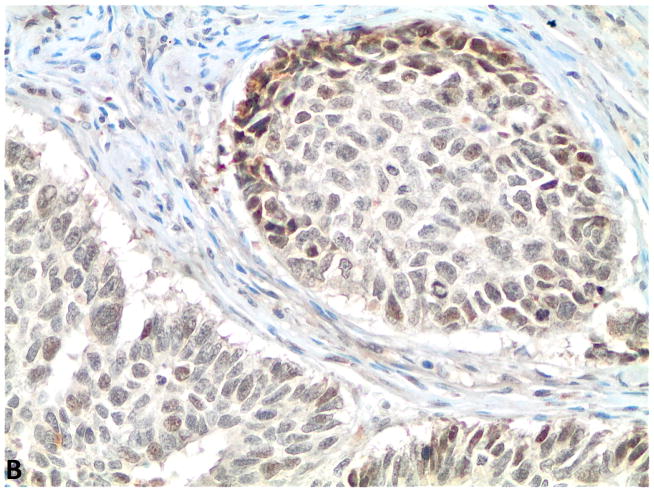
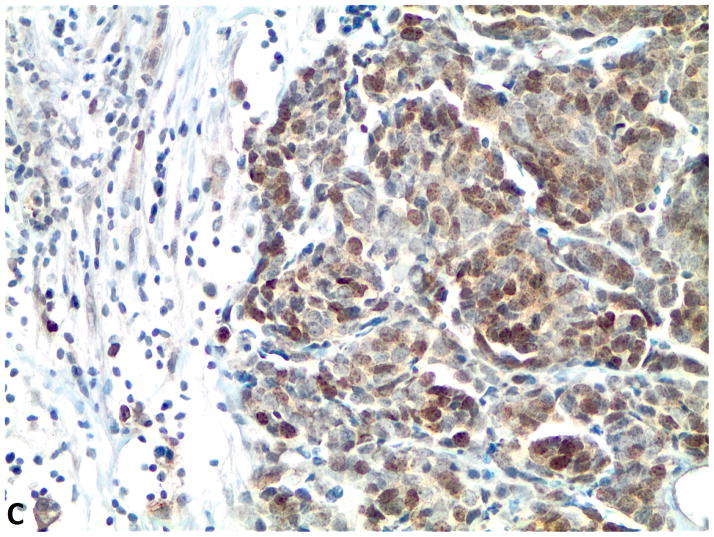
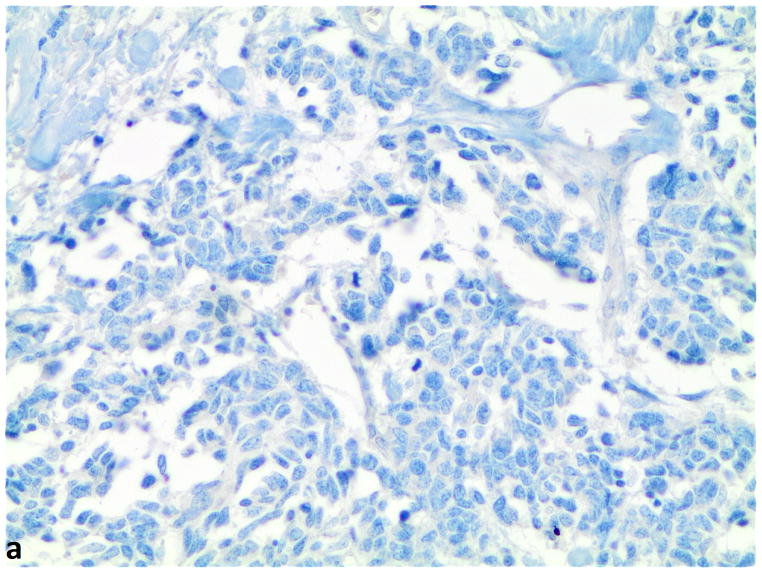
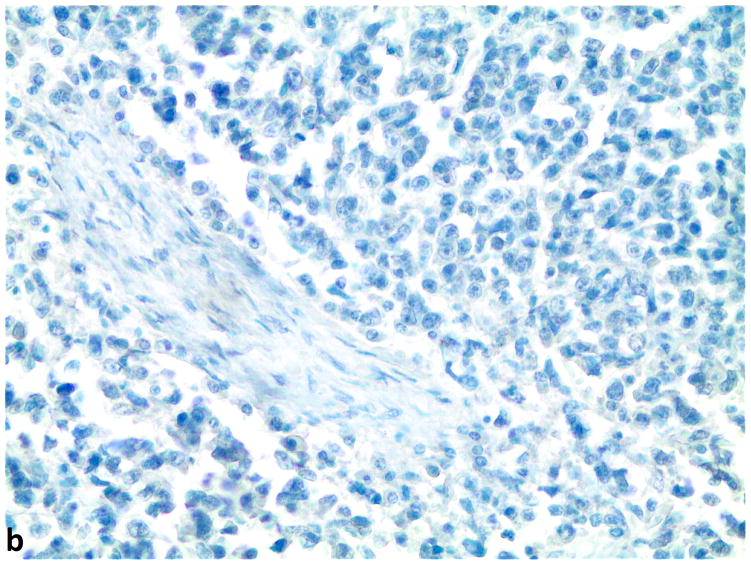
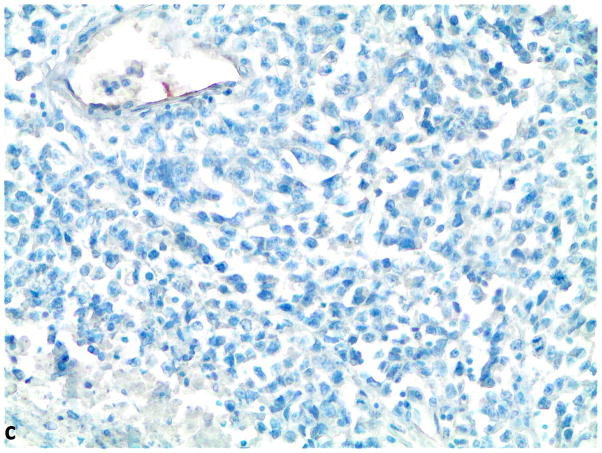
Figure 1.
A–C, FGFR1, FGF2 and FGF9 protein expression in small cell lung cancer (immunohistochemistry, 200x original magnification). A, Positive for cytoplasmic and membranous FGFR1 protein expression (H score=285). B, Positive for nuclear and cytoplasmic FGF2 protein expression (H score =160). C, Positive for nuclear and cytoplasmic FGF9 protein expression (H score=100); a–c, Negative for FGFR1, FGF2 and FGF9 protein expression (H score=0).

