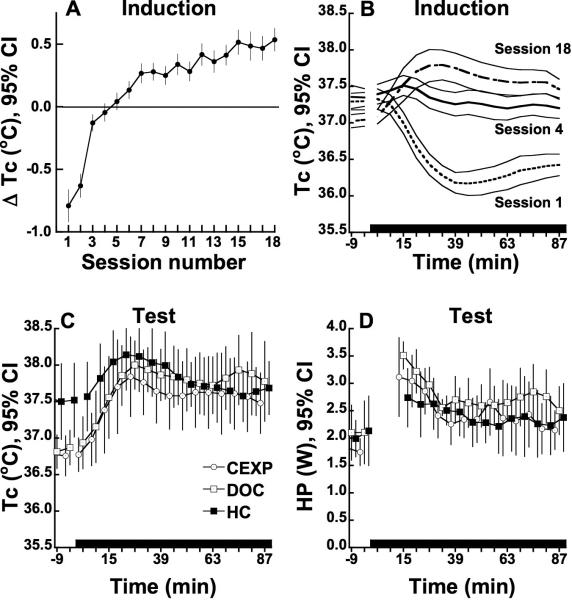
Figure 2.
A: Change in Tc from baseline during N2O inhalation in the induction phase in rats (n=24). Change values are adjusted for pre-N2O baseline Tc. 95% confidence intervals that exclude zero denote means that are significantly different from baseline at p<0.05. B: Temporal profiles of Tc during N2O inhalation in the induction phase. C: Temporal profiles of Tc during N2O inhalation in the post-extinction test session. Note the elevation in baseline Tc in the HC extinction group. D: Temporal profiles of HP during N2O inhalation in the post-extinction test session (n=8 per group). Extinction group key: CEXP: placement in calorimeter during extinction trials; DOC: initial brief N2O administration and placement in calorimeter during extinction trials; HC = remained in home cage during extinction period.

