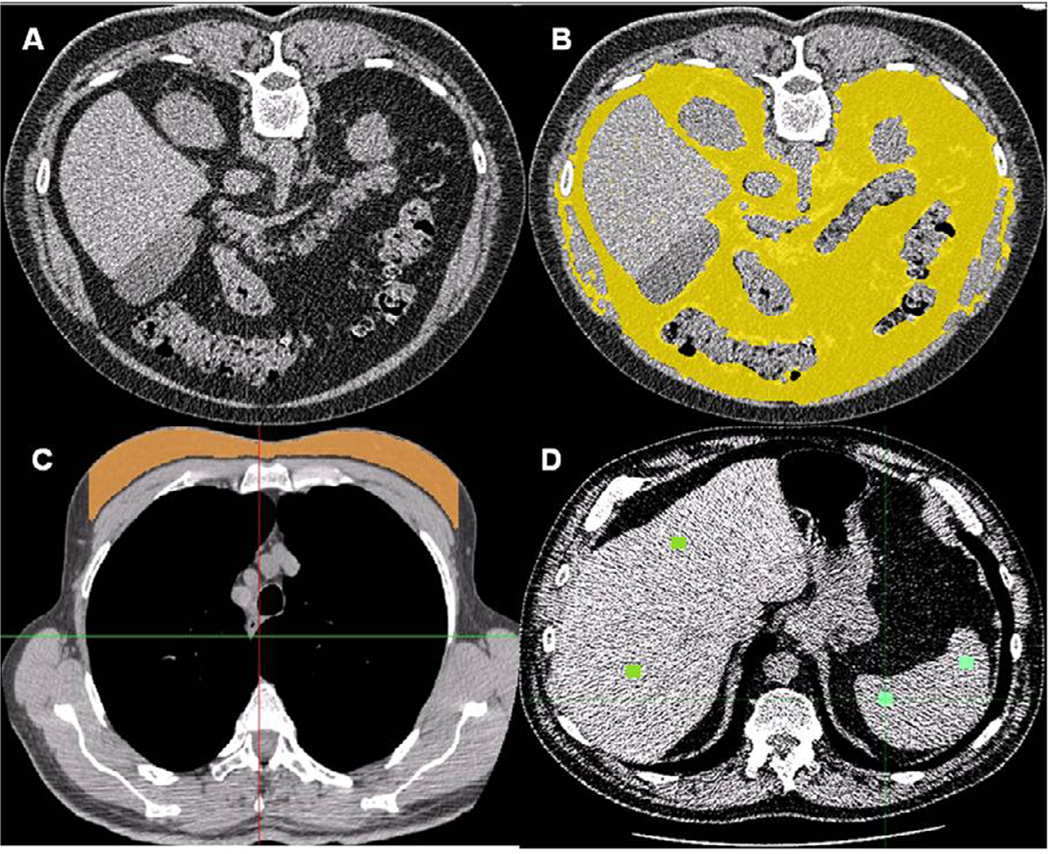
Figure 1. Illustration of Adipose Tissue Compartments Measured of Chest CT Scans.
Panel A shows an abdominal axial slice at the first lumbar vertebrae level. The visceral adipose tissue was then segmented (B). A chest axial slice depicts the subcutaneous adipose tissue area segmented at aortic arch level (C) and the regions of interest (colored spots) on the liver and spleen in which the attenuation was measured (D).

