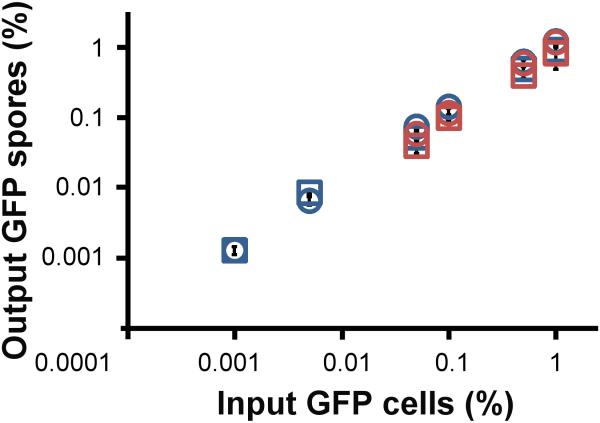
Figure 2. Cells with rare recognition cues produce equal amounts of spores in mixes with either compatible or incompatible strains.
We mixed GFP-labeled cells with compatible (control) or incompatible (experiment) unlabeled cells at the indicated frequencies (x-axis), allowed them to develop, collected the spores and measured the frequency of fluorescent spore at the end of development (y-axis). a, Blue squares, rare tgrB1AX4tgrC1AX4–GFP mixed with compatible tgrB1AX4tgrC1AX4 as a control. Blue circles, rare tgrB1AX4tgrC1AX4–GFP mixed with incompatible tgrB1QS31tgrC1QS31. Red squares, rare tgrB1QS31tgrC1QS31–GFP mixed with compatible tgrB1QS31tgrC1QS31 as a control. Red circles, rare tgrB1QS31tgrC1QS31–GFP mixed with incompatible tgrB1QS38tgrC1QS38. The data are means +/– s.e.m., and both axes are displayed in log10 scale. n= 3-5 per group, two-tailed student’s t-test between controls and experiments at each mixing frequency.

