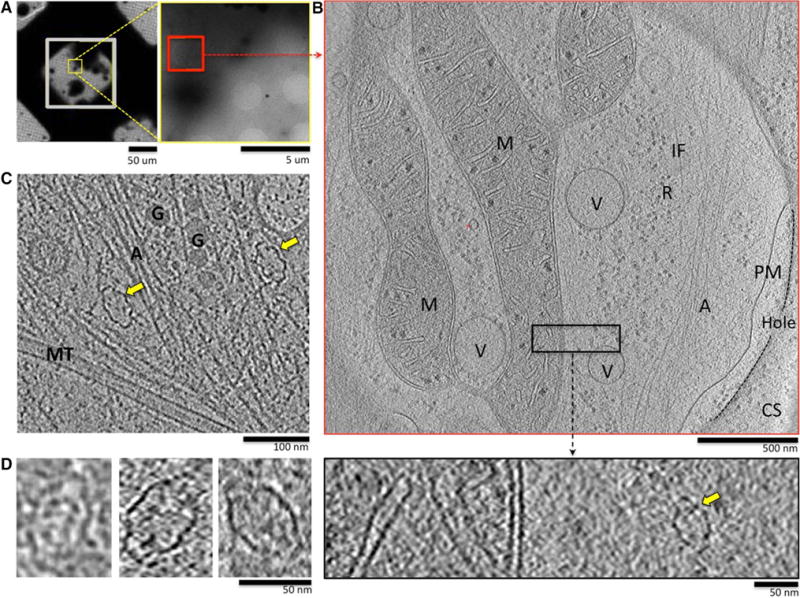
Fig. 1.

Vaults are readily observed by ECT in the thin cytoplasmic edges of cultured mammalian cells including HUVECs (a–c), Cos7 (d, left panel), NIH3T3 (d, middle panel) and HeLa (d, right panel), yellow arrows identify vaults in larger fields of view. a Left panel low magnification view of HUVECs growing on the carbon support of a gold EM grid; right panel higher magnification view of the yellow inset from left. b Top panel 14-nm-thick tomographic slice from a reconstruction of a tilt-series collected over the red inset in the right panel of a; the edge of the plasma membrane extends over a hole in the carbon support (CS); bottom panel close-up view of the black inset from tomogram in top panel. The tomographic slice has been adjusted to reveal the vault particle present (yellow arrow). A actin, G granule, IF intermediate filament, M mitochondria, MT microtubule, PM plasma membrane, R ribosomes, V vesicle, CS carbon support
